general
Using AI Chart Readers to Identify Emerging Stock Trends in 2026
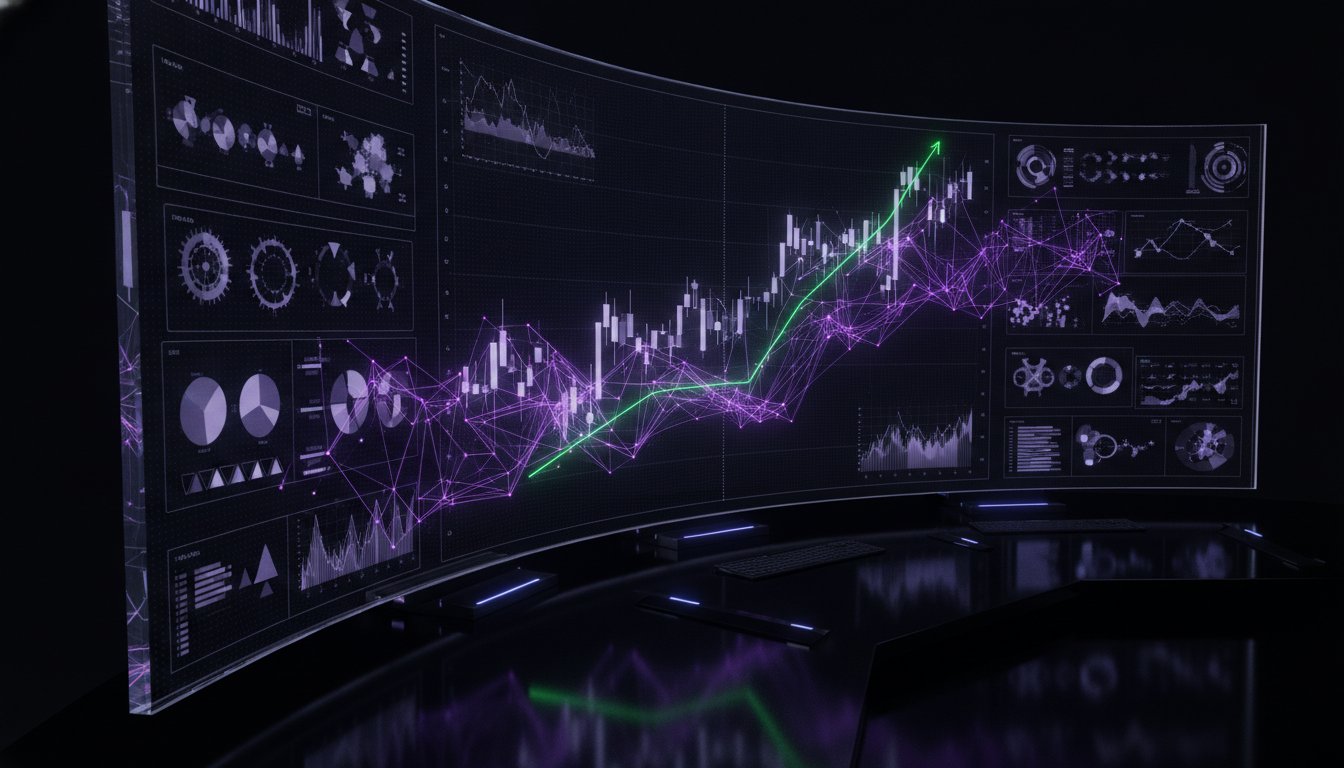
Master the future of trading. Learn how a stock ai chart reader identifies emerging trends and how to verify signals with social data for a competitive edge.
What if the most profitable signal on your screen wasn't a lagging indicator, but a real-time fusion of machine logic and collective human intelligence? Most traders in 2026 are still drowning in a sea of overlapping moving averages and complex oscillators, yet they still manage to blink and miss the explosive breakouts that define a successful year. It's frustrating to watch a stock ai chart reader spit out a "Buy" signal without understanding the data behind it. You've likely felt that sting of distrust when an opaque algorithm fails to account for the social momentum driving the price action.
We're changing that dynamic by moving beyond the black box. You're about to master the art of AI-driven technical analysis, learning how to automate tedious pattern recognition while maintaining total control over your strategy. This article breaks down how to receive objective, data-backed signals and, more importantly, how to verify those insights within a community of real, high-performing traders. We'll explore the tools that bridge the gap between cold numbers and social context, ensuring you never trade in a vacuum again. Get ready to turn information overload into your greatest competitive advantage.
Key Takeaways
Move beyond static indicators and learn how a modern stock ai chart reader uses machine learning to interpret visual price action with surgical precision.
Understand the three-layer analysis process that uncovers hidden support and resistance levels often missed by manual charting.
Automate your trend discovery by filtering the global market for specific breakout formations that align with your trading parameters.
Discover how to verify opaque AI signals by fusing algorithmic data with the collective intelligence of a verified social trading network.
Learn to navigate the Financial Tools Marketplace to find specialized AI readers that integrate directly into your professional trading terminal.
Table of Contents
The Evolution of Technical Analysis: From Manual Patterns to AI Chart Readers
How Stock AI Chart Readers Decode Market Data in 2026
Identifying Market Alpha: AI for Trend Discovery
Beyond the Black Box: Why Social Context Beats Solo AI Analysis
Integrating AI Intelligence with the Tyrian Trade Ecosystem
The Evolution of Technical Analysis: From Manual Patterns to AI Chart Readers
Technical analysis has undergone a radical transformation. For decades, traders relied on manual charting, squinting at screens to draw trendlines and identify wedges. Today, a stock ai chart reader functions as a sophisticated machine learning tool that interprets visual price action with a level of precision human eyes simply can't match. While traditional indicators like RSI or MACD calculate past price movements to guess future momentum, AI pattern recognition analyzes the actual geometry of the market in real time. It's the difference between reading a weather report and watching a live satellite feed of a storm forming.
2026 has officially become the year of agentic trading. In this environment, AI is no longer just a passive scanner; it's a proactive co-pilot that assists with strategy refinement and risk management. By processing millions of data points without emotional attachment, AI chart readers effectively eliminate the cognitive bias that causes traders to "see" a breakout because they want one to exist. This evolution is the natural successor to Algorithmic trading , moving from rigid "if-then" rules to fluid, adaptive intelligence.
Why Visual Pattern Recognition Matters in 2026
The latest generation of Large Language Models (LLMs) has developed advanced vision capabilities, allowing them to "see" candlestick formations exactly like a professional floor trader would. This isn't just about finding a double bottom; it's about speed and scale. An AI can analyze 500 different charts across global markets in the time it takes a human to draw a single trendline on a 15-minute SPY chart. This allows for holistic "market state" recognition, where the AI identifies the underlying environment, whether it's a low-volatility accumulation phase or a high-energy distribution top, before the first major move even happens.
The Shift from "Signals" to "Intelligence"
Modern traders are moving away from old-school black-box signal bots that offer "buy" alerts without context. In 2026, the demand is for explainable AI. You don't just want a signal; you want to understand the logic. Multi-modal AI now combines these visual chart insights with real-time news sentiment and social data to provide a 360-degree view of the market. This shift is a core component of AI stock trading in 2026 , where the goal is to provide traders with actionable intelligence rather than just raw data. It's about empowering the human at the terminal with the processing power of a supercomputer.
How Stock AI Chart Readers Decode Market Data in 2026
The mechanics of a modern stock ai chart reader rely on a sophisticated three-tiered architecture that processes data faster than any human brain could dream. It starts with data ingestion, where the system captures every micro-tick and volume spike across multiple timeframes simultaneously. Next, the pattern matching engine compares this live data against a massive library of historical instances. Finally, predictive modeling generates potential price paths based on current momentum. Unlike manual traders who might miss a slight divergence in volume, these systems identify hidden support and resistance levels by analyzing order flow and liquidity pockets that don't even appear on standard candlestick charts.
Professional-grade engines distinguish themselves from basic retail bots by providing backtested confidence intervals. Instead of a single price target, they offer a probability range based on historical success rates in identical market conditions. This transparency allows you to gauge the conviction of the AI before you commit capital. If you're looking for these high-tier tools, you can find specialized versions in a Financial Tools Marketplace where verified developers list their most advanced models for the community to use.
Machine Learning Models: Training on 50+ Years of Historical Data
Modern models like Claude 3.7 and specialized ML labs aren't just looking at yesterday's close. They're trained on over 50 years of market cycles, from the 1987 crash to the hyper-volatile 2020s. This historical validation ensures the AI doesn't get fooled by temporary anomalies. Traders now use natural language to write custom studies; you can literally tell the assistant to find every time a bull flag formed after a 5% gap up with declining volume and have a functioning indicator in seconds without writing a single line of code.
Real-Time Pattern Recognition vs. Lagging Indicators
Lagging indicators like moving averages tell you what already happened. A stock ai chart reader tells you what's happening right now by prioritizing price action as the primary source of truth. It identifies complex formations like wedges, flags, and head-and-shoulders with 99% precision. More importantly, the AI filters out market noise, those random price fluctuations that trigger false signals for manual traders. This allows you to focus strictly on high-probability setups that have clear institutional backing and structural integrity.
Identifying Market Alpha: AI for Trend Discovery
Finding an edge in the 2026 markets requires more than just raw data; it requires a systematic workflow that blends machine precision with human strategy. You can't just flip a switch and expect profits. Success starts with a clear plan. Whether you're hunting for high-velocity breakouts or fading overextended moves through mean reversion, your strategy dictates how you deploy your stock ai chart reader .
- Step 1: Define Your Parameters. Decide on your timeframe and setup. Are you looking for daily bull flags or 15-minute reversals?
- Step 2: Deploy the Scanner. Use your AI-powered tools to filter thousands of tickers. The goal is to find specific chart formations that match your criteria in seconds.
- Step 3: Generate the Blueprint. Once a setup is identified, the stock ai chart reader calculates precise entry points, stop-losses, and multiple take-profit targets based on historical volatility.
- Step 4: Technical Confirmation. Cross-reference these signals with volume profile and liquidity zones. If the AI sees a breakout but the volume profile shows a "low volume node" above, the trade might lack the fuel to continue.
- Step 5: The Social Reality Check. Verify the setup within a Social Trading Network. Seeing how other verified traders are positioning themselves provides the ultimate filter for community sentiment and institutional flow.
Setting Up Your AI-Powered Workspace
Efficiency is everything. You should integrate your chosen tools directly into a professional terminal online to ensure your data feed is low-latency and institutional-grade. Customize your alerts so that you're only notified when a trend shift occurs on your specific watch list. This prevents the "analysis paralysis" that comes from watching too many moving parts at once. By creating a curated list of AI-vetted opportunities, you can focus your mental energy on execution rather than hunting.
Refining Signals for Maximum Alpha
Never treat an AI signal as a blind command. Use an AI Financial Assistant to ask deeper questions about the chart's structure. You might ask, "How did this stock react to similar volume spikes in the last three earnings cycles?" This level of inquiry helps you validate technicals against fundamental drivers like SEC filings. This "Check-and-Balance" method ensures that you're using the AI as a high-powered lens, not a replacement for your own professional judgment. It's about combining the speed of the machine with the wisdom of the market.
Beyond the Black Box: Why Social Context Beats Solo AI Analysis
Solo AI is inherently fragile. While a stock ai chart reader can identify patterns with unmatched speed, it often struggles when the market enters unprecedented territory. AI models are trained on historical data, but they can't always predict how human psychology will shift during a "black swan" event or a sudden geopolitical pivot. This is the "black box" problem: receiving a signal without understanding the context. In 2026, the most successful traders have moved toward "Social AI," a resilient approach that treats algorithmic output as a starting point rather than a final command.
Collective Intelligence is the new gold standard for the modern terminal. Instead of trusting a single anonymous bot, you verify that signal against the actions of high-performing, verified peers. This turns a potentially "hallucinated" pattern into a high-conviction trade. By layering a stock ai chart reader with real-time human verification, you filter out the noise that a solo machine might mistake for a signal. It's about building a bridge between cold logic and the hot pulse of the live market.
The Trust Layer: Verified Participation
The antidote to AI-generated noise is reputation. Within the Tyrian Trade ecosystem, AI tools aren't just software; they're peer-reviewed assets in a Financial Tools Marketplace. This environment ensures that only the most reliable models rise to the top based on actual performance. Professional traders know that building a trading track record is the only way to command respect in 2026, and the same logic applies to the tools they use. Financial creators play a vital role here, providing the necessary narrative to explain why a specific AI pattern is valid or why it should be ignored in the current macro climate.
Sentiment Analysis: The Human Element of the Chart
Charts don't move themselves; people move charts. Combining AI chart reading with real-time social discussion data allows you to identify "crowded trades." An AI might see a perfect breakout setup, but social sentiment could reveal that the trade is over-extended and filled with retail participants ready to fold at the first sign of trouble. Community engagement serves as a leading indicator for trend sustainability. When a technical breakout is backed by a surge in verified social interest, the probability of a sustained move increases exponentially. You can join the conversation and verify these signals yourself by participating in our Social Trading Network today.
Integrating AI Intelligence with the Tyrian Trade Ecosystem
The final step in your evolution isn't just owning a stock ai chart reader ; it's embedding it into a professional-grade environment that values transparency over hype. While the retail market is flooded with standalone apps that offer opaque pricing and "sketchy" trials, Tyrian Trade provides a verified alternative. Our Financial Tools Marketplace acts as a curated hub where you can source specialized algorithms that have been peer-reviewed by the community. This eliminates the guesswork and allows you to focus on execution within a high-performance Trading Terminal.
Once you've selected your preferred tool, the Tyrian AI Financial Assistant steps in to provide the "why" behind the "what." It performs deep-dive market intelligence, analyzing order flow and historical volatility to give your technical setups a structural foundation. If the assistant flags an institutional liquidity zone that aligns with your AI's breakout signal, your conviction increases. For those who develop a knack for these high-probability setups, our Creator Monetization Tools offer a pathway to turn your insights into a revenue stream. You can share your AI-assisted analysis with a dedicated following, backed by a track record that the community can actually trust.
From Tool User to Market Leader
The transition from a solo trader to a recognized market participant is built on consistency. You can use these advanced tools to master financial trends and build a personal brand that commands professional respect. Tyrian’s Reputation Infrastructure ensures that your success isn't just a number on a screen; it's a verified credential within the network. This system is what defines Tyrian Trade as the next-generation financial intelligence network, where the "trust layer" protects you from anonymous noise while amplifying your best ideas.
Getting Started with AI Chart Analysis Today
Ready to deploy your first stock ai chart reader ? Use this final checklist to ensure you're starting on the right foot:
- Verify the Source: Choose a tool from the Marketplace with a high peer-review rating.
- Terminal Integration: Ensure the tool connects directly to your live data feed for low-latency signals.
- Social Validation: Post your setup in the Social Trading Network to see how seasoned traders are reacting.
- Risk Calibration: Use the AI Financial Assistant to set stop-losses based on real-time volatility, not just fixed percentages.
The markets in 2026 move too fast for manual hesitation. By fusing algorithmic precision with the collective wisdom of a verified community, you're not just trading; you're leading. Join the Tyrian Trade Social Network to access verified AI tools and start identifying the trends that others are still squinting to see.
Master the Future of Market Intelligence
The era of squinting at charts and hoping for the best is over. You've seen how a modern stock ai chart reader automates complex pattern recognition and surfaces alpha that manual analysis simply misses. By combining this algorithmic precision with social verification, you move from guessing to knowing. It's about using technology to amplify your strategy, not replace your judgment. Success in 2026 requires an environment that values transparency and verified results above all else.
Tyrian Trade provides that foundation through a verified reputation system for all participants and access to professional-grade AI Financial Assistants. You're no longer trading in a vacuum; you're plugged into a community-driven market intelligence network designed for collective success. The tools to dominate the next cycle are at your fingertips, and the barrier to entry has never been lower for those ready to innovate.
Ready to upgrade your terminal experience? Explore the AI Tools Marketplace on Tyrian Trade and start building your verified track record today. The next major trend is already forming; make sure you're the one who sees it first.
Frequently Asked Questions
What is the best AI chart reader for beginners in 2026?
Beginners thrive with tools found in the Tyrian Financial Tools Marketplace. These readers prioritize visual clarity and peer-reviewed reliability. A top-tier beginner tool doesn't just give a signal; it explains the logic behind the pattern. By leveraging Tyrian's reputation infrastructure, you can select tools that other successful traders have already vetted. This reduces the learning curve and helps you build confidence in your setups from day one.
Can an AI chart reader really predict stock market crashes?
No tool can predict the future with 100% certainty, but an AI chart reader excels at identifying the structural decay that precedes a crash. It analyzes liquidity pockets and volume exhaustion patterns that are invisible to the naked eye. By comparing current data to 50 years of historical cycles, the AI flags high-risk environments. Use these insights as a defensive shield to adjust your risk parameters before the volatility spikes.
How much does a professional stock AI chart reader cost?
Pricing for professional tools is modular and depends on the specific features you need. In the current market, basic AI indicators might start around $10 per month, while comprehensive professional suites can exceed $300 monthly. Instead of looking for the cheapest option, focus on tools with a verified reputation in a trusted marketplace. This ensures you're paying for actual performance and data integrity rather than just a shiny interface.
Is AI chart analysis better than traditional technical analysis?
AI analysis is a high-speed upgrade to traditional methods. While manual technical analysis relies on lagging indicators like moving averages, AI interprets real-time price action geometry. It eliminates the human bias that often leads to "seeing" patterns that aren't there. By processing 500 charts in the time it takes you to draw one trendline, AI provides a massive scale advantage that traditional manual charting simply can't match.
Do I need coding skills to use an AI chart reader?
You don't need a single line of code to use these tools. Most professional terminals in 2026 feature an AI Financial Assistant that understands natural language. You can simply ask the AI to find all stocks with a daily bull flag and rising relative volume to get instant results. This shift allows you to spend your time refining your market strategy instead of debugging scripts or learning complex programming.
How do I know if an AI trading tool is a scam?
The biggest red flag is a lack of transparency. Legitimate AI tools operate within a reputation infrastructure where developer track records are public and verified. If a tool promises guaranteed profits or uses anonymous black box logic without peer reviews, stay away. Always source your software from a Financial Tools Marketplace that emphasizes verified participation. This trust layer is your best defense against the anonymous signal bots that plague the industry.
Can I use AI chart readers for crypto and forex as well as stocks?
Most professional-grade stock ai chart reader engines are multi-modal, meaning they work seamlessly across crypto and forex markets. The underlying principles of price action and liquidity remain consistent regardless of the asset class. By using a unified trading terminal, you can apply the same AI-driven logic to a Bitcoin breakout as you would to a tech stock. This flexibility is essential for traders who want to maintain a diversified global portfolio.
What is the difference between an AI scanner and an AI chart reader?
Think of an AI scanner as a wide-angle lens and a stock ai chart reader as a microscope. The scanner's job is to sift through thousands of tickers to find those that meet your basic strategy parameters. Once the scanner identifies a potential candidate, the reader performs a deep-dive analysis of that specific chart's structure. It provides the granular detail needed to set precise entry, stop-loss, and take-profit targets for the trade.