Historical Data Shows S&P 500 Gains After U.S. Midterm Elections
Kalshi market odds currently assign Democrats a 93% chance of winning the House and a 74% chance of taking the Senate.
Historical market data offers an interesting perspective on how U.S. midterm elections have coincided with stock market performance:
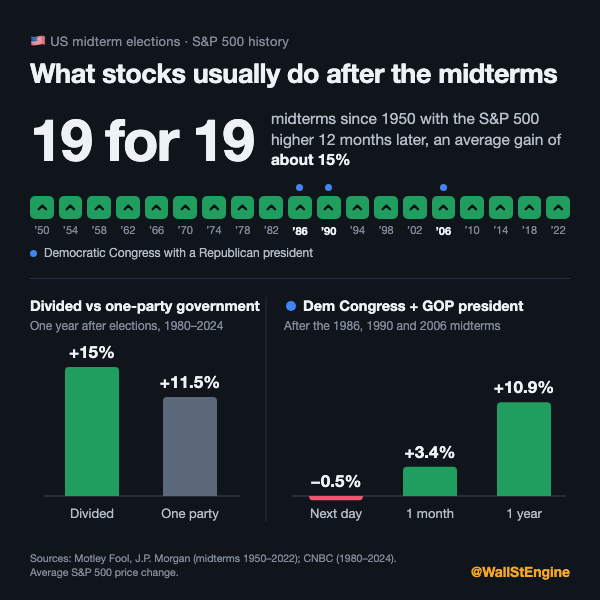
🔹 The S&P 500 finished higher 12 months after all 19 midterm elections since 1950, with an average gain of 15.4%.
🔹 Under divided government, the index historically averaged a 15% gain over the following year.
🔹 Under one-party control, the average gain was 11.5%.
Looking specifically at the 1986, 1990 and 2006 midterms, when Democrats controlled Congress under a Republican president, the S&P 500 recorded:
🔹 Next day: -0.5%
🔹 After 1 month: +3.4%
🔹 After 1 year: +10.9%
The historical figures suggest that the S&P 500 has often performed positively following midterm elections, regardless of the political balance of power.
However, past performance does not guarantee future returns, and election outcomes are only one of many factors influencing the stock market.