general
AI trading terminal tools
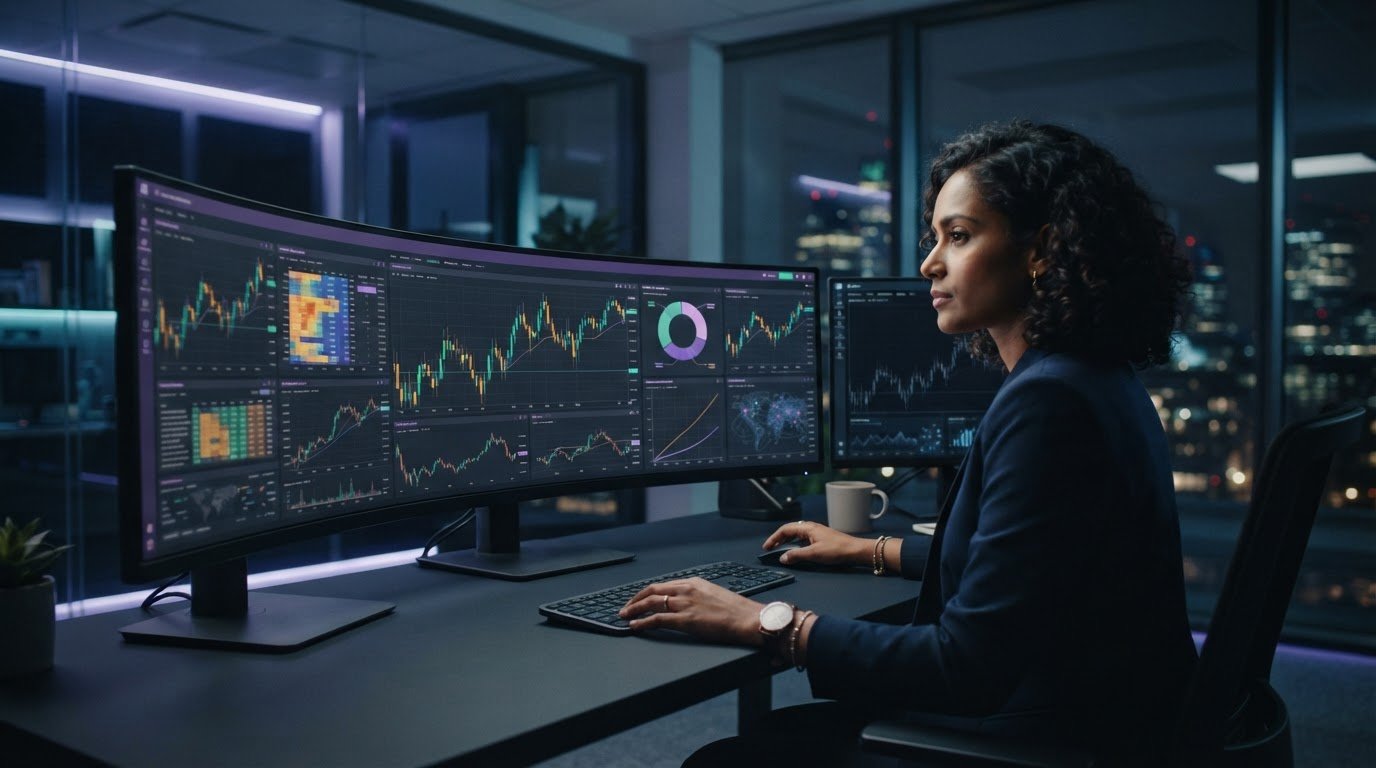
Explore AI trading terminal tools for building strategies, backtesting ideas, comparing platforms, and understanding where human judgment still matters.
AI trading bots can follow a defined strategy automatically, but automation alone does not make that strategy effective. AI trading terminal tools help traders analyze market data, define rules, and test ideas before applying them. The key is knowing what the system can do and where human judgment still matters.
It is natural to want a faster way to spot patterns and test decisions. But a bot is only as useful as its strategy, data, and settings. This guide explains how AI trading bots work, how to create and backtest a strategy, and what to compare when choosing a trading platform. You will also learn how to assess the tools behind the interface, from market analysis and historical data to risk controls, so you can make an informed choice without mistaking automation for a shortcut to success.
Key Takeaways
Assess bots by how they use market data and apply a strategy, not by claims of effortless returns.
Turn chart ideas or plain-language rules into clear conditions that can be tested and refined.
Use historical backtests to examine performance metrics and spot weaknesses before relying on a strategy.
Compare platforms by their data, strategy-building, testing, and analysis tools to find a workflow that fits your needs.
Table of Contents
Do AI trading bots actually work?
Creating strategies from chart drawings and plain-English descriptions
Historical backtesting and performance metrics
AI trading platform rankings
Tyrian Trade: Social Trading Network
Do AI trading bots actually work?
AI trading terminal tools can automate rules, but they cannot make every strategy effective. Their usefulness depends on the inputs, logic, and safeguards behind each decision. Assess the process, not the AI label.
Market Data and Financial Inputs
Start by reviewing the information that shapes a bot’s decisions. Live market data tracks price and volume, while news can add context to sudden moves. Macroeconomic indicators and financial statements provide broader economic and company-level perspectives. For example, a stock screener may detect rising momentum, but an earnings announcement could change how you interpret that signal. AI trading terminal tools are most useful when their data sources match the strategy and timeframe.
Regime Analysis and Market Scanning
Macro indicators can help distinguish changing market conditions, such as expansion or elevated volatility. A momentum strategy may behave differently during a selloff than during a rally, so regime analysis can add context to automated rules. Screeners filter stocks by chosen indicators, while real-time scanning surfaces matches as conditions change. In 2024, the CFTC issued a customer advisory warning that AI can’t turn trading bots into money machines. Risks include faulty inputs, overfitting, outages, and exposed account credentials. In the United States, whether a terminal is subject to specific rules depends on its activities and the services involved.
Historical Data and Backtesting
Backtesting applies strategy rules to historical prices to examine how they behaved in past conditions. Some trading terminals advertise more than 20 years of historical data, but coverage and data quality matter. Review drawdowns, trade frequency, and results across different market regimes, rather than focusing only on a headline return. AI trading terminal tools can help organize this analysis, but a historical test can’t predict future performance.
Before relying on automated trading, inspect the rules and test them with simulated orders. If results depend on a narrow market condition, revisit the assumptions and run the test again. This process helps show whether the bot’s logic is understandable and repeatable.
Creating strategies from chart drawings and plain-English descriptions
Start with a specific chart idea, then turn it into rules a system can test. For example, mark a resistance zone and define what should happen when a stock closes above it. An AI interface may generate a draft strategy, but traders still need to set entry conditions, exits, and filters. Clear rules make the analysis easier to review.
Charting tools combine price action with technical indicators such as moving averages or the relative strength index. You might draw a trendline, then specify whether a price break or retest triggers an entry. Some platforms translate chart strategies into a scripting language. Review generated code line by line, especially the conditions for orders and exits.
Automated chart and pattern recognition can flag formations such as triangles, channels, or head-and-shoulders patterns. Treat each match as a prompt for analysis, not proof that a price move will follow. Check the timeframe, price points, and volume context. A pattern on a daily chart may not support the same decision on an intraday chart.
Free AI charting and technical analysis tools can help traders explore indicators, summarize chart conditions, or generate a first-pass strategy. Features differ by platform, so focus on what the tool actually lets you test. With AI chart-image analysis, upload or select a chart and ask for observations, such as visible support zones. Then compare those observations with the underlying chart data.
Before live trading, test the generated rules against historical data and adjust one condition at a time. For instance, filter a moving-average strategy by volume, then compare its results with the unfiltered version. Sentiment can add context, but define how it enters the rules rather than treating a summary as a signal. A connected trading workspace can bring chart review and strategy work together.
Historical backtesting and performance metrics
A backtest applies strategy rules to historical prices and records simulated trades. Read the results as a way to examine assumptions, not as a forecast.
Historical Strategy Testing
On an algorithmic trading platform, set the asset, time period, entry rules, and exit rules before running a test. A quantitative strategy might buy when one moving average crosses another, then close the position when its exit condition is met. Check whether the platform models commissions, spreads, and slippage. Minute-level data can reveal timing details that daily candles hide, but its usefulness depends on data quality and the strategy.
Performance Metrics
Compare several measures rather than relying on total return alone. Net return shows the result after modeled trading costs; maximum drawdown shows the largest peak-to-trough decline. Win rate counts profitable trades, while profit factor compares gains with losses. A high win rate can still come with a deep drawdown, so review metrics together. Robust analysis also considers consistency across market conditions, not just the strongest historical period. For investors seeking signals designed specifically to navigate volatility and avoid significant drawdowns, platforms like alphashield.ai offer specialized market insights.
Separate strategy design from evaluation. Use one historical period to develop the rules, then test them unchanged on a different period. If performance collapses, the strategy may be overfit to past price movements. Repeat the test across different stocks and market environments, and record how each change affects the result. Changing several conditions at once makes it harder to identify what caused a difference.
Next, use paper trading to observe the strategy with simulated orders as live market prices move. Compare its entries, exits, and position sizes with the backtest. A gap between simulated results and historical performance can reveal timing assumptions, missed signals, or execution limits. Paper trading checks the strategy against live data, but does not reproduce every condition of a real order.
Before relying on a platform’s summary, inspect its trade log. Confirm that each entry follows the stated rule and that each exit uses the intended price. Export results when possible, then compare the equity curve, drawdowns, and losing streaks. This step-by-step review turns a polished dashboard into evidence you can question and understand.
AI trading platform rankings
Rankings are useful only when their criteria match your trading workflow. Compare supported markets, data sources, strategy tools, and broker integration instead of treating a top position as a universal recommendation. A machine-learning label alone reveals little about how a model generates analysis or handles changing conditions.
Which AI trading terminals support stocks, options, forex, and crypto? Coverage varies by platform and its market-data or broker connections. Check each asset class directly, then confirm that charting, screening, and strategy testing support the markets you plan to analyze. For currency-focused traders exploring automated setups, specialized developers like RobotForexPro offer Expert Advisors designed specifically for forex and gold markets.
Start with the workflow. A desktop terminal may suit detailed chart analysis, while a web-based platform can make access across devices easier. Next, consider how its AI models support research: can they summarize market information, surface patterns, or help define entry and exit rules? Useful integration connects these steps without obscuring how the analysis was produced.
- Market coverage: Confirm the platform supports your intended stocks, options, forex, or crypto markets.
- Strategy tools: Look for clear ways to create, test, and revise rules.
- Data and analysis: Assess whether the available information fits your timeframe and approach.
- Workflow: Compare desktop access, integrations, and how easily you can inspect results.
Then try the same task on each platform you are considering. For example, screen stocks for momentum, open a chart, and trace how a strategy defines entry and exit conditions. Note whether the interface makes assumptions visible or hides them behind a generated result. This practical comparison reveals more than a ranking badge.
Use rankings as a shortlist, not a final verdict. Match the platform to your markets, preferred analysis, and testing workflow, then review its tools in context. Explore a connected trading workspace to see how market analysis and trading tools can fit together.
Tyrian Trade: Social Trading Network
Tyrian Trade brings market participants together through a Social Trading Network, connecting analysis with community discussion. Turn to it when you want to explore financial tools alongside shared perspectives, rather than working from a terminal in isolation. The Financial Tools Marketplace and AI Financial Assistant add resources for examining market information, while Live Streaming for Financial Creators gives creators a space to share their market-focused content. These offerings complement the research and strategy evaluation covered above; they don’t replace your own testing or judgment. If you’re ready to explore a more connected trading environment, visit Tyrian Trade .
Make your next analysis more deliberate
Make your next step a small, observable experiment. Choose one market question, decide what evidence would change your view, and record your reasoning before acting. This keeps AI trading terminal tools in a supporting role: they can help organize analysis, while you remain accountable for the decisions and assumptions behind it.
Build a routine you can revisit. Note what information shaped your judgment, what you expected, and what you learned afterward. Over time, this record can help you distinguish a useful process from a compelling-looking result. Keep refining your questions as markets and your priorities change.
Tyrian Trade brings market participants into a connected environment through its Social Trading Network, Financial Tools Marketplace, and AI Financial Assistant. If that combination fits how you want to explore market analysis, contact Tyrian Trade today . Take your next step with curiosity, clear reasoning, and a process you can keep improving.
Frequently Asked Questions
Is there an AI that will trade stocks for me?
Yes, some systems can automate stock orders when connected to a compatible brokerage account with trading permissions. Others only analyze data or generate strategy ideas, leaving order placement to you. Before enabling automation, review the connection’s requested permissions, whether you can set position limits, and how to pause the system. First decide whether you need research support or automated order handling.
What is AI stock trading?
AI stock trading uses software to analyze market information and support decisions about stocks. A system might classify company news, detect price patterns, or apply a model to a watchlist. Its output depends on the data and rules it receives. For example, an alert about unusual volume is an observation, not a complete explanation of what caused the change in trading activity.
Why Use It?
Use AI tools to organize repetitive research, compare scenarios, or monitor a watchlist while you focus on decisions that require context. A trader following several industries could use automated summaries to identify which earnings announcements deserve closer review. The benefit is a more structured workflow, not guaranteed performance. Keep a record of what the tool surfaced and how you responded.
How much do popular AI trading terminals cost, including commissions and data fees?
Total costs depend on the platform’s subscription structure, selected data feeds, and any connected broker’s commissions or other charges. Separate these costs before comparing plans: a low subscription price may not include the market data you need, while trading costs can depend on the account and its activity. Review the current terms for each service and calculate costs based on your intended workflow.
How do AI trading terminals generate signals and automate trades?
A terminal processes inputs such as prices, indicators, or company information using user-defined rules or analytical models. It may then display an alert or, with an authorized broker connection, route an order that meets set conditions. For example, a rule could flag a price crossing a chosen threshold. Review the trigger, order type, and permissions before enabling automation.
How do leading AI trading terminals compare on backtesting, charting, and risk controls?
Compare terminals using the same sample strategy and workflow. Check whether charts let you inspect the inputs behind a result, backtests show trade-level records, and risk settings let you limit order size or pause automation. A platform that makes assumptions and controls easy to inspect may suit a different workflow from one focused on faster analysis.