general
Backtesting Trading Ideas Without Coding: See How Strategies Perform
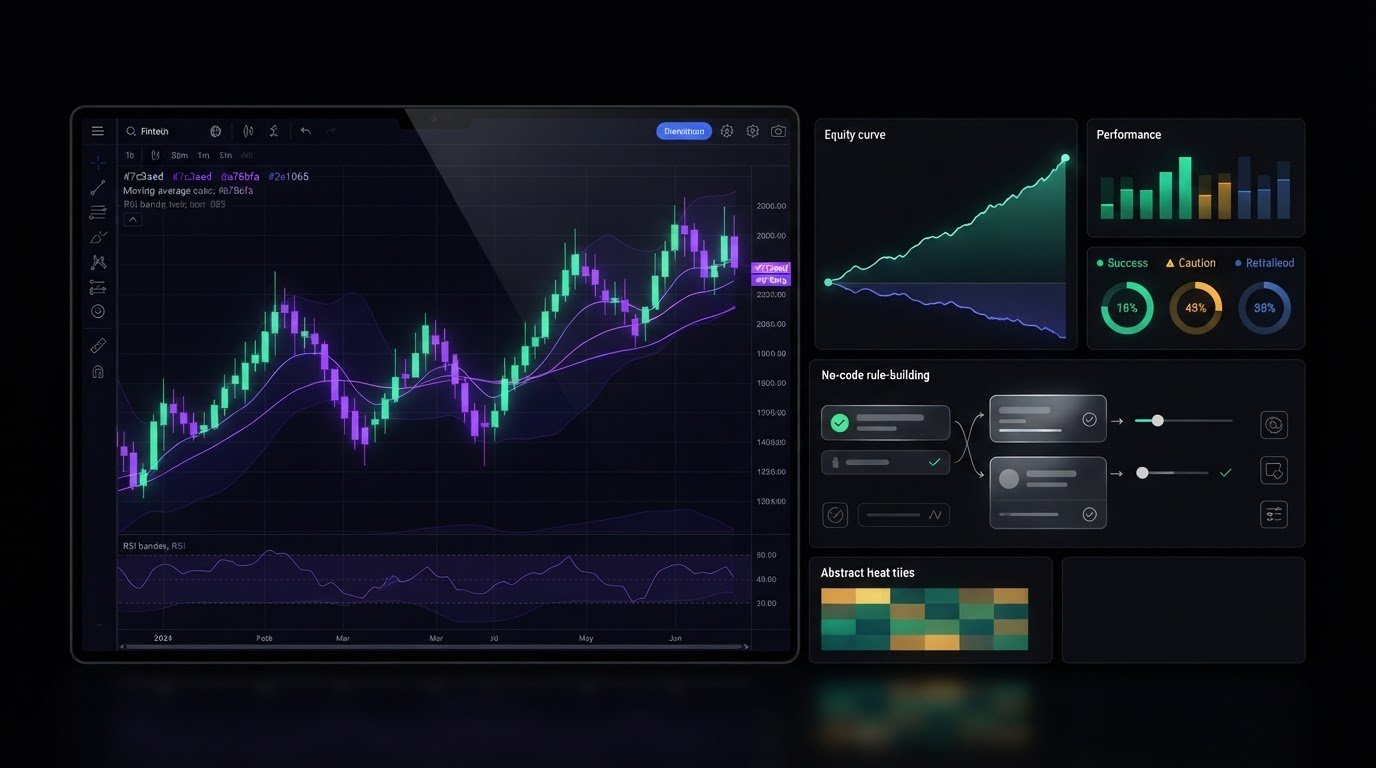
Master backtesting trading ideas without coding. Discover how to evaluate visual rules, analyze profit metrics, and choose the best no-code platform today.
You can backtest trading ideas without coding: visual tools and prebuilt rules let you test conditions such as a 9 EMA crossing above a 21 EMA on a 15-minute chart. You can also test an RSI strategy that buys below 30 and sells above 70. Coding can help with more complex ideas, but it isn’t a requirement for exploring straightforward rules.
It’s sensible to look for evidence before putting a strategy into practice. A backtest shows how your rules would have performed on historical data, but its results depend on the data, assumptions, and metrics used.
This guide explains what no-code platforms can test, how to interpret measures such as profit factor and maximum drawdown, and what to compare when choosing a tool. It also explains why win rate alone can be misleading and how to assess whether results merit closer review.
Key Takeaways
You can test clear trading rules with no-code tools; coding becomes more useful as a strategy grows more complex.
Learn how market coverage and historical data shape what a backtest can reveal about your idea.
Look beyond headline returns: compare risk, consistency, and changes in the equity curve to get a fuller performance picture.
Assess platforms by their supported markets, testing features, data quality, strategy limits, and available execution or export options.
Use Tyrian Trade’s social and financial tools to explore market insights and connect with a trading community.
Table of Contents
Do I need to know how to code to backtest a trading strategy?
Supported asset classes and market inputs
Benefits of no-code backtesting tools
Equity curves and monthly performance breakdowns
Features to look for in a backtesting platform
Tyrian Trade: Social Trading Network
Do I need to know how to code to backtest a trading strategy?
No. Visual builders and plain-English AI can test rule-based trading strategies without code. The key is defining precise conditions and examining more than headline returns.
Testing Strategies on Historical Data
Historical data lets a backtesting tool apply your rules to past price movements and record hypothetical trades. To test without coding, choose a market and timeframe, set entry and exit conditions, add risk rules, then run the test and review its results. For example, test a 9 EMA crossing above a 21 EMA on a 15-minute chart.
A backtest with at least 50 trades provides a rough statistical picture, not a promise of future performance. Review return on investment, win-loss ratio, profit factor, maximum drawdown, and the equity curve. A profit factor above 1.3 is a baseline worth investigating; above 1.5 is strong. Compare strategies across different historical periods, not just one favorable stretch.
Creating Strategies with Plain-English AI
Plain-English AI turns a written trading idea into conditions a backtesting tool can evaluate. For example, you might describe buying when RSI drops below 30 and selling when it rises above 70. The tool can translate those instructions into a testable rule set, then show the resulting trades and performance measures.
AI-assisted refinement works best as a cycle: inspect the results, identify a rule to adjust, and rerun the test. Change one condition at a time, such as the RSI threshold or exit rule, so you can see what affected performance. A 40 percent win rate with 3R winners can outperform a 60 percent win rate with 0.5R winners. That’s why win rate alone can mislead.
Building Entry, Exit, and Risk Rules
Visual builders represent a strategy as selectable conditions linked in sequence. Entry rules define when a trade opens; exit rules specify when it closes; risk settings can include a stop-loss, position size, or profit target. For example, a 2R profit target sets an exit relative to the amount risked on a trade.
To backtest without coding, specify the market, timeframe, entry and exit triggers, and risk controls, then run the test and review its trades and statistics. In a visual builder, add each condition separately and confirm how the platform combines them. For example, check whether both indicators must agree before an entry.
Account for commissions, slippage, and spreads by including them in each simulated trade where the platform allows. Taxes can affect net results too, so assess them using the rules relevant to your trading activity. A 15 percent maximum drawdown, for example, is a point to compare with your ability to follow the strategy through losses.
Supported asset classes and market inputs
No-code backtests depend on the markets a platform covers and the data it uses. Check both before building rules around price, volume, trading sessions, or timeframes.
How accurate are no-code backtests? Results reflect the historical data and assumptions used, not a guarantee of live performance. Missing prices, coarse data, and simulated fills can all affect the outcome.
Historical Market Data
Historical market data records past prices and related inputs used to replay a strategy’s rules. Coverage matters: the test needs the right instruments, timeframes, and trading periods to represent your idea.
An intraday strategy, for example, needs data detailed enough to show short-term price movements. A longer-term rule may use daily prices instead. Check the available history, bar intervals, volume fields, and whether the platform includes the sessions your strategy uses.
Data Accuracy and Limitations
Data accuracy describes how well historical records and simulated trade assumptions represent the market conditions being tested. Gaps or simplified fills matter because they can make results differ from what traders might experience.
Check whether historical prices account for events such as stock splits, and whether the test models spreads, slippage, and commissions. Inspect missing bars and session settings too. Daily bars cannot show the same price sequence as finer intraday data, so a simulated entry or exit may differ.
Asset-class support varies by platform. Check specifically for the markets you want to test, such as equities, futures, foreign exchange, or crypto. A broad market label does not necessarily mean every instrument, exchange, or trading session is covered. Test the exact symbol and timeframe your rules require before comparing results.
Market inputs shape a test as much as the asset does. A price-only strategy needs different fields from one that uses volume or session timing. Confirm the tool provides each input and check how its builder interprets the condition. For example, a rule tied to the market open depends on the platform’s session and time-zone settings.
Backtesting and live execution are different capabilities. Some platforms focus on historical simulation; others also offer exports or connections for live workflows. Distinguish simulated orders from live execution, and check which markets those features cover. A test result does not place a trade.
For a fair comparison, keep the instrument, timeframe, historical period, and rule settings consistent across tests. Change one input at a time, such as switching from daily to intraday data, and note how the trade sequence changes. This helps reveal whether a result comes from the strategy or the data setup.
Benefits of no-code backtesting tools
A visual interface turns a trading idea into testable conditions without requiring code. One practical benefit of backtesting trading ideas without coding is moving quickly from an idea to an experiment. Select a condition, set its threshold, and choose the resulting action. This leaves more time to assess the logic and less time troubleshooting syntax.
Changing a rule is simple. If a moving-average setup produces too many entries, adjust its conditions and rerun the test. Change one parameter at a time and compare results. That makes it easier to identify the effect of each adjustment, rather than changing several rules and losing track of what drove the difference.
Visual rule blocks can also make a strategy easier to explain and review. A teammate can see that an entry depends on an indicator crossing a threshold instead of having to interpret code. For traders exploring backtesting trading ideas without coding, this visibility can make the assumptions behind each condition easier to discuss.
Templates offer another useful starting point. An opening-range breakout template, for example, can use the first 15-minute or 30-minute range as its reference. You can inspect its conditions and adjust them to fit the idea you want to test. A template accelerates setup, but it doesn’t establish that its rules suit your goals.
No-code tools can help compare markets or timeframes when the platform supports them. Keep the core rules consistent and change one input, such as the timeframe. Comparing outcomes can show whether the strategy’s behavior shifts. Record the conditions for each version so you can distinguish a genuine difference from an accidental rule change.
Backtesting can also lead into a more measured forward test. One suggested approach is beginning at 50 percent of normal position size for 20 to 30 trades, then comparing live results with backtest expectations. If live performance is close to backtest expectations, a cautious next step may be to increase position size gradually. These are testing guidelines, not performance promises.
Platform comparisons are more useful when based on the same task. Try the same sample idea across 2 to 3 no-code platforms using free trials before committing. Compare how clearly each handles your rules, supported markets, and result review. That focused exercise reveals which workflow suits your skills and makes experimentation easier to repeat.
Equity curves and monthly performance breakdowns
An equity curve plots an account’s value across a strategy’s simulated trades. Its shape shows how returns accumulated, where losses clustered, and whether growth depended on a few standout trades. Read it alongside return on investment and maximum drawdown: a rising finish can hide steep declines along the way.
Check the curve’s overall direction, then examine its dips and recoveries. A gradual climb with repeated pullbacks tells a different story from a flat line followed by a sharp jump. For instance, a strategy reliant on a single winning trade may look less consistent over its full history.
Maximum drawdown helps quantify the deepest decline from a peak to a later trough. A 15 percent drawdown is an example to assess against your ability to stick with a strategy. On the equity curve, locate that decline and examine the trades behind it. The pattern can show whether losses were clustered or spread across changing market conditions.
Monthly performance adds a calendar view to the equity curve. Compare each month’s returns, losses, and trade count to see which periods drove the overall result. A strong curve may conceal weak months or uneven activity. Treat monthly figures as context, not a verdict: a month with few trades may reveal less than one with repeated opportunities.
Use the monthly view to assess whether your strategy’s parameters behave consistently. If an indicator threshold or exit rule changed, compare the periods before and after the adjustment. Record each version and its settings. Otherwise, you could mistake a parameter change for a market shift or compare results produced by different rules.
Win rate also needs the context of average wins and losses. A 40 percent win rate with 3R winners can be more profitable than a 60 percent win rate with 0.5R winners. An equity curve helps reveal the path behind that outcome, while a monthly breakdown can show whether gains came steadily or in concentrated bursts.
Expectancy connects average outcome to risk per trade. For a $50,000 account risking $500 per trade, +0.3R expectancy equals an average of $150 per trade. Use that relationship to interpret the strategy’s results, not as a prediction. Compare it with the curve’s drawdowns and monthly variation before deciding what the backtest suggests.
For a useful review, compare three views: the equity curve, monthly results, and individual trades. Note the largest declines, strongest and weakest months, and rules active in each period. This turns a performance chart into a focused assessment of the strategy’s behavior, rather than a single headline number.
Features to look for in a backtesting platform
Choose a platform that supports the markets and rules you want to test. Compare its data, backtesting features, complexity limits, and available next steps before settling on a workflow.
Supported markets: Confirm that the platform covers the specific assets and instruments in your strategy. A broad label such as “crypto” or “equities” may not identify the available symbols, exchanges, or trading sessions. Test your intended market and timeframe, then check whether the same rules can run consistently across them.
Backtesting capabilities: Assess how the platform lets you build conditions and review results. Can you test entries, exits, and risk parameters in a visual interface? Can you inspect individual trades as well as summary statistics? A strategy using indicator conditions, for example, needs a builder that supports those inputs, not just a template library.
Historical data quality: Review available timeframes, data coverage, and how the platform handles gaps or adjusted prices. Daily-bar and intraday tests can produce different simulated entries because they show different levels of price detail. Check that the historical period and session settings match the strategy you want to evaluate.
Complexity limits: No-code tools simplify strategy building, but each platform supports a different range of conditions. A basic moving-average crossover may suit a simple visual builder. A strategy with multiple indicators, time filters, and conditional exits may need more flexible logic. List your strategy’s requirements before deciding how well a tool fits your skills.
Execution or export options: Backtesting is simulation; execution involves live orders. Check whether the platform offers exports or connects to a separate execution workflow, and distinguish these features from historical testing. Exporting results can help you examine them elsewhere, but simulated performance is not equivalent to live trading.
Pricing and usability: Compare pricing structures with the features you’ll use, such as market coverage or data access. Then try the interface with a sample strategy. A clear workflow makes it easy to find settings, identify the rules used in a test, and review results without losing track of changed parameters.
For a practical comparison, evaluate 2 to 3 no-code platforms using free trials before committing. Apply the same sample strategy and market inputs to each, then note differences in data quality, rule flexibility, results, and export options. This side-by-side test turns platform selection into a focused analysis, rather than a choice based on interface design alone. Explore a connected trading environment as you assess which tools fit your workflow.
Tyrian Trade: Social Trading Network
Tyrian Trade brings market participants together through its Social Trading Network, where people engage with financial ideas and community perspectives. After reviewing a backtest, use this social context to compare how others discuss market conditions while keeping your own rules and results in view.
The Financial Tools Marketplace lets you explore financial software and tools. The AI Financial Assistant supports market intelligence, while Live Streaming for Financial Creators offers a real-time way to follow financial discussions. These features complement independent strategy analysis; they do not replace your assessment of historical results or risk.
To connect your market research with a broader trading community, visit Tyrian Trade online.
Turn your next trading idea into a learning loop
Treat each strategy as a question, not a verdict. What market behavior are you trying to understand? Which assumption might change your view? Let those questions guide your next tests, and keep your reasoning visible as your ideas evolve.
Backtesting trading ideas without coding can make experimentation more accessible, but its value depends on thoughtful interpretation. Use results to sharpen your understanding, compare perspectives, and decide what merits further study. Tyrian Trade’s Social Trading Network connects you with a community around market ideas, while its Financial Tools Marketplace and AI Financial Assistant support a broader research workflow.
Bring curiosity, clear reasoning, and an open mind to your next analysis. Contact Tyrian Trade to explore how its connected financial tools can fit into your market research.
Frequently Asked Questions
Can I test strategies on stocks, forex, futures, and crypto?
Yes, if the platform has historical data for the specific market and instrument. Support can vary within an asset class: a tool may cover some stock symbols or crypto pairs but not every exchange or contract. Before building a test, match the symbol, trading session, and timeframe to your rules. This helps prevent testing a strategy on data that does not represent its intended market.
How Do No-Code Backtesting Platforms Compare?
Platforms differ in market and historical data coverage, the rules they let you build, and how they present results. To compare them, run the same strategy with identical inputs on each. Note whether you can inspect individual trades, adjust assumptions, and export results. A clear interface helps, but the key question is whether the tool supports your strategy’s conditions and provides enough detail to interpret its output.
How do I choose a no-code trading platform?
Start with your intended market and strategy, then compare platforms against those requirements. Check data coverage, rule-building flexibility, and options for reviewing or exporting results. Try a sample test to see how easily you can find settings and interpret the output. Free trials can reveal practical workflow differences between platforms. Consider pricing too, weighing it against the features you’ll use.
How many trades should a backtest include for reliable results?
At least 50 trades can provide a rough statistical picture, but that count alone doesn’t make a result reliable. Check whether the trades span different market conditions and whether a few unusually large wins dominate the outcome. For example, compare the full results with the strongest trade removed. If performance changes sharply, the headline statistics may depend heavily on a small part of the sample.
Is no-code trading as powerful as coded trading?
No-code tools can handle many rule-based strategies, while coded systems offer more control over complex logic and custom calculations. A simple moving-average condition may suit a visual builder; a strategy requiring multiple linked data sources may need code. Choose based on the rules you need to express, not the label. No-code reduces syntax work but does not remove the need to understand assumptions and test results.
What Features Should a No-Code Backtesting Tool Have?
Look for coverage of your intended markets, useful historical data, and a builder that supports your entry, exit, and risk rules. Results should be easy to inspect, including individual trades and summary measures. Compare complexity limits, export options, and connections to execution workflows too. These features determine whether a platform can support your process, from testing an idea to reviewing its behavior.
What types of strategies can I test without code?
You can test strategies built from conditions a platform’s visual builder supports, including indicator triggers, price breakouts, and defined exits. For instance, an opening-range breakout can use the first 15-minute or 30-minute range as its reference. A fixed risk-to-reward exit can also be expressed as a rule. More unusual logic may exceed a builder’s available conditions, so match the strategy to its rule options.
What no-code platforms let you backtest trading strategies?
Backtesting is available through platforms with visual rule builders, template-based strategy tools, or AI features that translate plain-language rules into tests. Compare actual data coverage and supported conditions rather than relying on a platform label. Tyrian Trade offers a Financial Tools Marketplace for financial software and a Trading Terminal, alongside its AI Financial Assistant. These offerings support a broader trading workflow, but do not mean every tool listed performs backtesting.