education
Charting Platforms Comparison for Smarter Trades
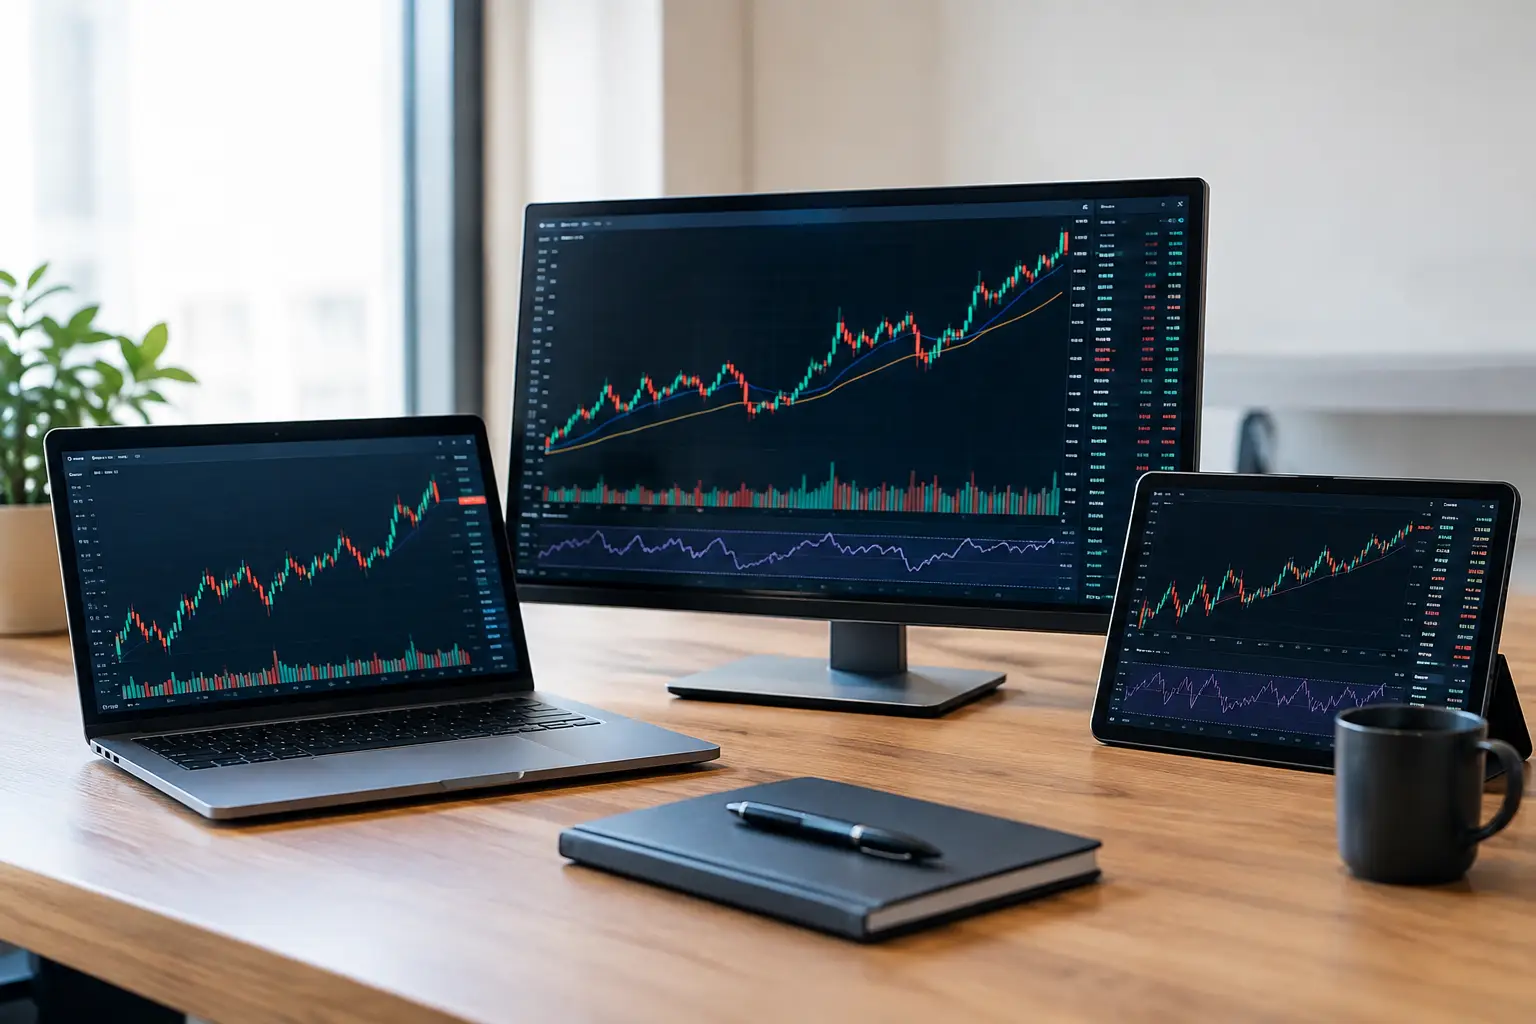
Use this charting platforms comparison to assess data quality, tools, speed, integrations, and community insight before committing capital with confidence.
A chart can look precise while giving a trader the wrong context. Delayed quotes, adjusted prices that do not match your broker, missing futures data, or an indicator calculated differently than expected can turn a clean setup into a poor decision. A useful charting platforms comparison starts with that reality: the best platform is not the one with the most indicators. It is the one whose data, workflow, and intelligence match how you actually make decisions.
For active traders, charting software is no longer just a place to draw trendlines. It is the decision surface where price action, portfolio exposure, market news, alerts, research, and community conviction meet. The right choice reduces fragmentation. The wrong one creates more tabs, more manual checks, and more room for avoidable errors.
Charting Platforms Comparison: What Actually Matters
Most platform comparisons begin with visual features: chart types, drawing tools, color themes, and indicator libraries. Those details matter, but they are rarely the deciding factor for serious market participants. Nearly every established platform can display candlesticks, moving averages, volume, and relative strength. The real differences appear in data integrity, market coverage, execution connections, automation limits, and how well the platform supports a repeatable process.
Start with the markets you trade. A stock investor who reviews daily and weekly structure has different needs from a forex trader managing intraday entries or a crypto participant monitoring 24/7 volatility. Ask whether the platform offers reliable coverage for your instruments, exchanges, and trading hours. Also verify whether data is real-time, delayed, consolidated, or exchange-specific. “Real-time” may still require separate exchange agreements, especially for futures and certain equity feeds.
Then examine price construction. Corporate actions, futures contract rolls, dividend adjustments, and cryptocurrency venue differences can materially change a chart. A long-term investor may prefer adjusted equity history. A short-term trader may need raw prices that correspond closely to an execution venue. Neither preference is universally correct, but the platform should make the distinction clear.
Data quality is a trading feature
A charting environment earns trust when a trader can understand where the numbers come from and what they represent. Look for clear symbol definitions, session settings, time-zone controls, and transparent treatment of adjusted data. If you use volume profile, VWAP, market breadth, or order-flow tools, determine whether the required data is available at the needed granularity.
This becomes more important when comparing assets across markets. A crypto chart from one exchange is not automatically representative of the entire market. A forex quote can vary by liquidity provider. An index may be calculated differently from the futures contract traders use to express the same macro view. Good platforms make those differences visible rather than hiding them behind a familiar ticker.
Evaluate the Workflow, Not Just the Feature List
A charting platform should help you move from observation to action without forcing you to rebuild your context every session. That means layouts, watchlists, alerts, annotations, scanners, and saved templates deserve as much scrutiny as indicator counts.
Consider a common workflow: you identify relative strength in a sector, compare several names, mark levels, check broader market conditions, set alerts, and later review whether the trade followed your plan. A capable system should preserve that chain of thought. If your watchlist is disconnected from your charts, your alerts lack context, and your trade history lives elsewhere, the platform may be adding friction instead of removing it.
For investors, portfolio-aware charting is especially valuable. A compelling chart can still be the wrong trade if it increases concentration in one sector, factor, country, or digital asset. Platforms that connect market analysis with portfolio analytics help users judge an opportunity in the context of existing risk. That is a more mature decision model than evaluating every setup in isolation.
Alerts should be specific and actionable
Basic price alerts are useful, but they are only the starting point. More advanced workflows may require alerts based on percentage moves, volume conditions, indicator thresholds, trendline breaks, earnings dates, or changes in a custom watchlist. The question is not whether the platform has alerts. It is whether alerts arrive quickly, remain easy to audit, and point you back to the relevant chart and thesis.
Avoid building an alert system so dense that every market movement becomes a notification. The goal is to surface decisions that deserve attention, not to create an always-on noise machine. A smaller set of well-defined alerts generally produces better behavior than dozens of loosely configured triggers.
Compare Analysis Tools by Your Trading Style
Technical traders should look beyond the raw number of indicators. An extensive public library can be useful, yet it can also create a false sense of precision. Evaluate whether tools can be customized, combined, and tested consistently. Can you inspect the assumptions behind a script? Can you standardize templates across symbols and time frames? Can you avoid repainting behavior or unclear calculations?
For discretionary traders, drawing tools and multi-time-frame views are central. The practical test is speed: can you mark a level, compare correlated markets, and return to the same layout tomorrow without losing clarity? For systematic traders, the priority shifts toward scripting, historical testing, data access, and realistic handling of costs and fills. A backtest that ignores slippage, liquidity, and survivorship bias is research, not proof.
Fundamental investors need a different layer of context. Financial statements, valuation metrics, earnings calendars, economic releases, and news may matter more than a complex oscillator. The strongest setup is often a charting environment that lets users combine technical structure with the catalysts and financial data driving the move.
AI-assisted analysis can help here, provided it remains explainable. Pattern recognition, market summaries, and anomaly detection can speed up research, but they should support judgment rather than replace it. Traders should be able to see the underlying data, challenge the signal, and decide how much weight it deserves.
Social Features Need a Trust Standard
Trading communities can add meaningful market intelligence. They can also amplify rumors, hindsight charts, and unverified performance claims. That makes community design a core consideration in a modern charting platforms comparison, not an optional extra.
Look for platforms that distinguish commentary from verified activity, provide context around contributors, and make it easier to assess a trader's consistency over time. A screenshot of a winning trade is not a record. Reputation becomes more useful when it is tied to transparent participation , documented ideas, and a history that can be evaluated rather than simply marketed.
This is where a connected financial intelligence network can offer an advantage over standalone chart software. On Tyrian Trade, the broader opportunity is not just to view price action, but to place research, portfolio insight, educational content, market discussion, and trading tools in a trust-centered environment. For users who learn and trade through community input, the quality of that layer is as important as the chart itself.
Integration, Security, and Cost Are Part of the Decision
A platform can have excellent charts and still fail operationally. Check how it fits with your broker, exchange accounts, tax tools, portfolio tracker, and preferred research sources. Direct execution can be valuable for active traders, but it also raises the stakes: order controls, connection reliability, account permissions, and confirmation workflows must be clear.
Security deserves equal attention. Review multi-factor authentication, device management, account recovery procedures, data permissions, and the platform's approach to third-party integrations. If you connect brokerage data or use automated tools, understand precisely what access is being granted and how it can be revoked.
Price should be judged as total operating cost, not the headline subscription. Add exchange fees, premium data, advanced indicators, API access, broker commissions, and the time cost of maintaining separate tools. A free charting product may be sufficient for a long-term investor. A trader who relies on intraday data and rapid alerts may save more through a paid system that reduces missed information and manual work.
Make the Choice With a Real-Market Test
Before committing, run each finalist through the same one- or two-week process. Build your normal watchlists, recreate a few saved chart templates, configure alerts, review historical trades, and test the platform during the market hours that matter to you. If possible, compare its prices with the source used for execution.
Do not choose based on a perfect demo chart. Choose the environment that remains clear when markets move quickly, news breaks, and you need to explain why a position belongs in your portfolio. The platform that supports disciplined decisions under pressure is usually worth more than the one with the longest feature page.