education
A Practical Guide to Unified Trading Dashboards
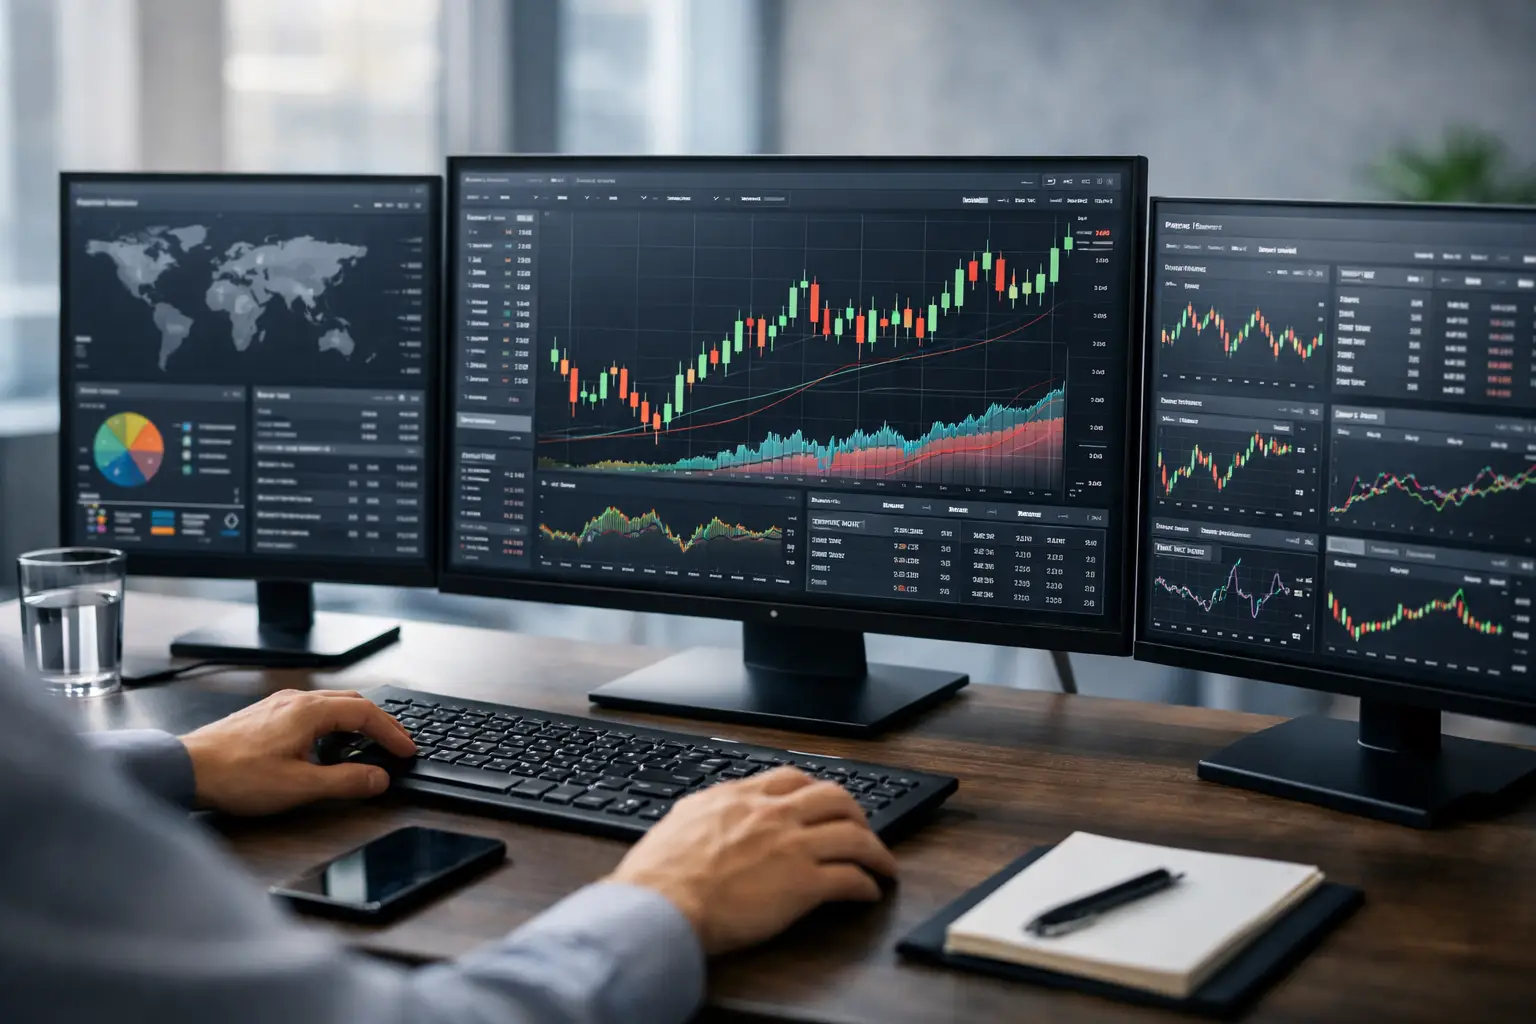
Use this guide to unified trading dashboards to connect market data, portfolio analytics, trusted ideas, and execution workflows in one clear daily view.
A fast-moving market exposes every gap in a fragmented workflow. A trader may spot a setup on one charting tool, check risk on a separate portfolio app, search social feeds for context, and then place an order through another interface. By the time those steps are complete, the opportunity, price level, or market narrative may have changed. This guide to unified trading dashboards explains how a connected workspace can reduce that friction without reducing the discipline serious trading requires.
A unified dashboard is not simply a screen with more widgets. It is a decision environment that brings market intelligence, portfolio context, trading tools, and credible community signals into one operational view. Built well, it helps traders spend less time switching tabs and more time evaluating the information that actually changes a decision.
What a Unified Trading Dashboard Should Do
The core job of a unified trading dashboard is context management. Markets generate more information than any one person can process: prices, volume, earnings, macro releases, order activity, news, technical levels, on-chain data, sentiment, and commentary. A useful dashboard does not attempt to display all of it at once. It organizes the signals around the user, their holdings, their watchlists, their preferred markets, and their current risk exposure.
For an active equity trader, the center of the workspace may be a watchlist, a real-time chart, position data, and an economic calendar. A crypto participant may prioritize exchange pricing, funding rates, wallet activity, volatility conditions, and verified market discussions. A longer-term investor may care more about allocation drift, earnings trends, sector exposure, and research notes. The infrastructure should support each workflow without forcing every participant into the same layout.
That distinction matters. A dashboard that is too generic creates noise. A dashboard that is highly customizable but poorly designed can become another maintenance task. The best systems provide a strong default view, then allow users to tailor alerts, modules, and market coverage as their process develops.
Why Fragmented Trading Workflows Create Risk
Fragmentation is often described as an inconvenience. In practice, it can become a risk issue. When account information, market data, research, and social commentary live in separate places, traders lose time and may make decisions with incomplete context.
Consider a position that moves sharply after a headline. If the trader sees the price move but not the position's percentage impact, related sector movement, upcoming event risk, or relevant market discussion, the response can become reactive. A unified dashboard cannot eliminate uncertainty, but it can put the right questions in front of the user sooner.
There is also a trust problem. Financial content spreads quickly, especially when volatility rises. Screenshots, performance claims, and trade calls can look credible without being verifiable. A connected trading environment should make reputation, participation history, and disclosures easier to assess. The goal is not to tell users what to trade. It is to help them distinguish market intelligence from noise.
The Essential Layers of a Unified Trading Dashboard
A capable platform combines distinct layers of information into a coherent experience. Each layer serves a different decision need, and none should be treated as a substitute for the others.
Market intelligence and real-time awareness
The market intelligence layer answers a simple question: what is moving, and why might it matter? This includes live prices, charts, watchlists, volatility measures, market breadth, calendars, and relevant news or research. For multi-asset participants, it should support equities, crypto, forex, and global markets without making cross-market analysis difficult.
The value is not just speed. It is relevance. Alerts should be tied to meaningful conditions, such as a price level, an unusual volume threshold, a volatility change, or a scheduled event. A constant stream of generic notifications creates alert fatigue, which can be as damaging as having no alerts at all.
Portfolio analytics and risk context
Price action is only part of the picture. A portfolio analytics layer turns positions into risk context by showing allocation, concentration, realized and unrealized performance, correlation, exposure by sector or asset class, and potential drawdown sensitivity.
This is where unified dashboards become especially useful for self-directed investors. A trade can look attractive in isolation while increasing an already concentrated exposure. For example, adding another semiconductor stock may feel like diversification because it is a different ticker, but portfolio analytics may reveal that the account is already highly dependent on the same industry cycle.
Analytics are not predictions. They are a clearer record of what the trader owns, how positions are connected, and where assumptions may be concentrated.
Research, ideas, and verified participation
Social trading features are valuable when they improve discovery rather than amplify hype. A dashboard should help users see ideas, market commentary, educational content, and live discussion alongside the evidence needed to evaluate them.
Verified participation changes the quality of the conversation. When a contributor's history, methodology, or disclosed positioning can be understood, users have a stronger basis for judging credibility. That does not mean a verified trader will always be right. It means reputation can be earned through transparent participation instead of manufactured through follower counts alone.
Tyrian Trade is built around this connected model, combining market intelligence, portfolio analytics, educational content, and community-driven discovery with an emphasis on transparent, verifiable participation.
Execution and workflow control
A dashboard becomes operational when it supports the path from observation to action. Depending on the platform and the user's account setup, that may include order tools, position monitoring, risk parameters, trade journaling, and post-trade review.
Execution should not be designed to encourage impulsive activity. Fast access is useful, but so are safeguards: order previews, clear position sizing, visible fees where applicable, and confirmation of the market or order type selected. A good interface makes it harder to confuse speed with quality.
How to Build Your Dashboard Around Decisions
Start with the decisions you make repeatedly, not with every available feature. A day trader may need to answer: What is in play? What level matters? How much risk is already open? A swing trader may focus on event dates, trend structure, and portfolio overlap. An investor may review allocation, earnings, and research quality each week rather than every minute.
Create a primary workspace for the current session and a secondary view for broader review. The primary workspace should stay focused. It might include a watchlist, charts, open positions, and alerts. The secondary view can hold deeper analytics, research libraries, trade journals, and longer-term performance data.
This separation prevents a common mistake: filling a single screen with so much information that no signal stands out. More modules do not automatically create more insight.
It also helps to establish a consistent review sequence. Before entering a position, check the market condition, the catalyst or thesis, the trade level, position size, and portfolio impact. After exiting, record what happened relative to the plan. A dashboard is most valuable when it reinforces a repeatable process instead of becoming a faster way to improvise.
AI Assistance: Useful, but Not a Decision Substitute
AI-powered analysis can improve a unified dashboard by sorting large volumes of information, identifying unusual market conditions, summarizing research, surfacing related assets, and highlighting portfolio patterns that may otherwise be missed. For traders handling multiple markets, this can materially reduce research time.
The trade-off is overreliance. AI can recognize patterns and synthesize inputs, but it does not carry the user's capital, time horizon, or personal risk tolerance. Its output depends on the quality and timeliness of the data available, and market regimes can change faster than a model's historical assumptions.
Treat AI as an analytical partner. Ask it to expose relationships, generate questions, and prioritize review. Do not treat a generated signal, summary, or sentiment score as a stand-alone investment thesis.
Privacy, Data Quality, and the Trust Layer
A unified interface concentrates valuable information, which makes data governance central to the product experience. Users should understand what account data is connected, what is shared with the community, how performance is calculated, and whether market data is delayed or real time.
Transparency also applies to analytics. If a platform presents a performance metric, users should be able to understand the methodology behind it. If a contributor shares an idea, disclosures and track record context should be visible where relevant. Trust is not a badge placed on top of a product. It is the result of clear systems, credible data, and accountable participation.
The right dashboard will not make markets predictable. It can make a trader's process more connected, more transparent, and easier to review when the next decision arrives.