education
Trader Analytics Dashboard for Better Decisions
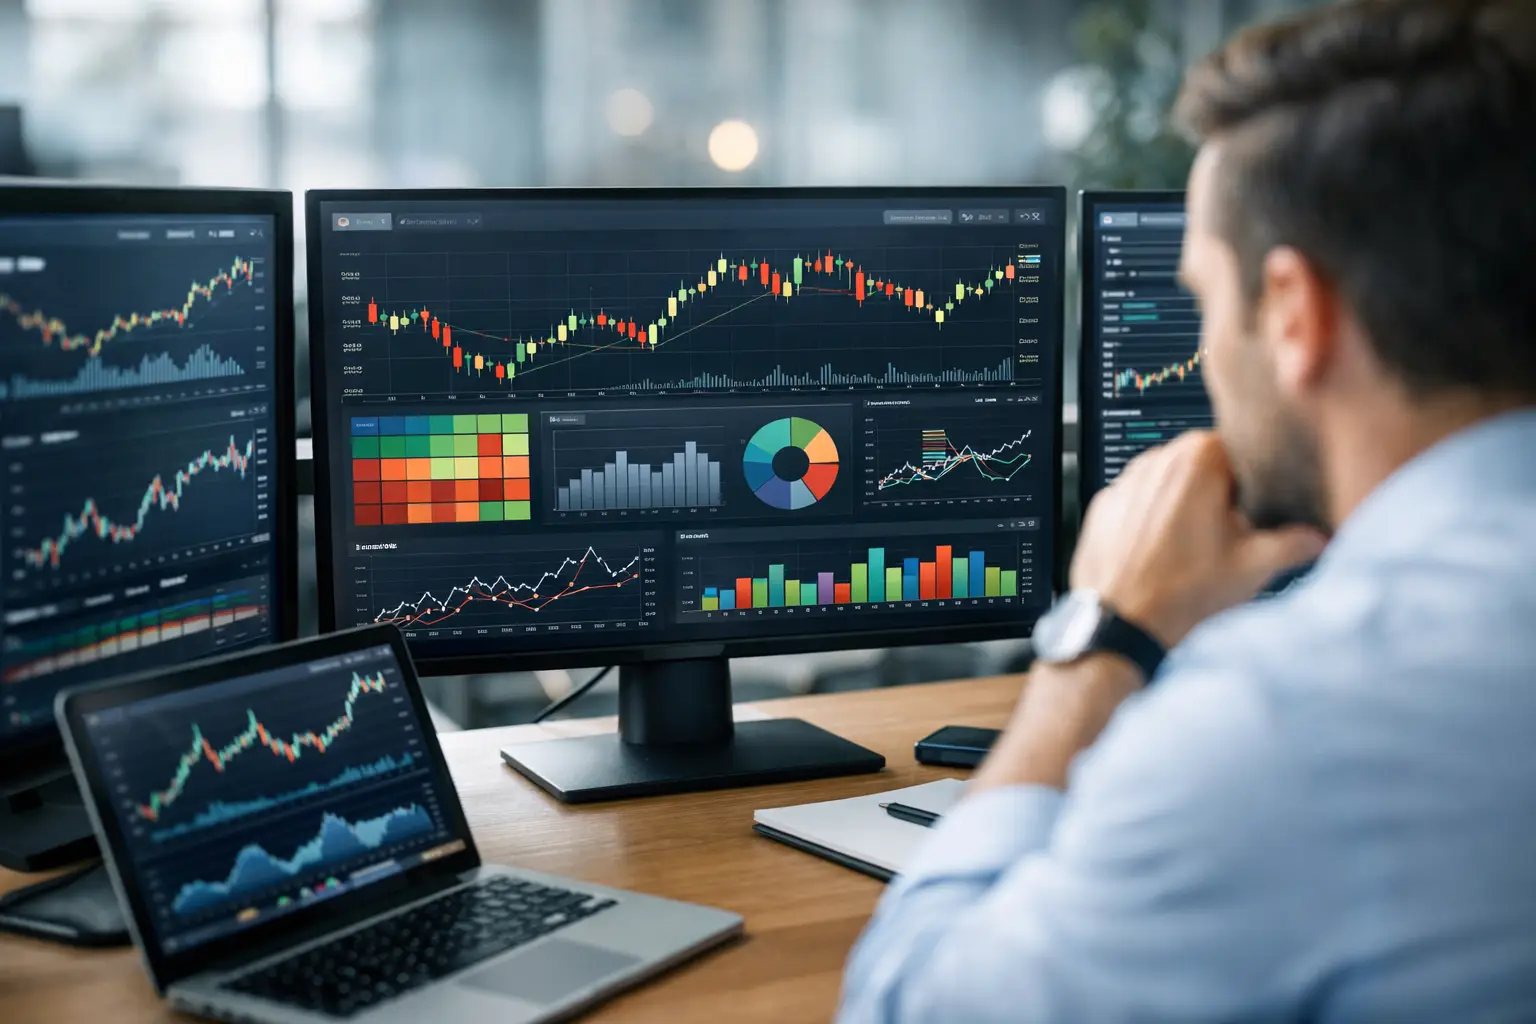
A trader analytics dashboard turns scattered positions, risk, performance, and market context into decisions you can review, verify, and improve daily.
A profitable trade can hide a weak process. A losing trade can still be the correct execution of a disciplined plan. Without a trader analytics dashboard, those distinctions disappear into broker statements, screenshots, chat messages, and memory. The result is familiar: traders react to P&L instead of understanding the decisions, exposures, and conditions that produced it.
For active participants across stocks, crypto, forex, and global markets, analytics should do more than display account balances. It should create a clear operating picture: what is working, where risk is accumulating, which decisions repeat, and whether performance is driven by skill, market conditions, or luck.
What a Trader Analytics Dashboard Should Actually Do
A dashboard is not valuable because it contains more charts. It is valuable because it shortens the distance between market activity and an informed decision. That means connecting portfolio data , trade history, market context, and risk signals in one environment rather than asking users to assemble a view from disconnected tools.
At its core, a trader analytics dashboard should answer four questions quickly: What do I own or have open? How much risk am I carrying? How has my process performed? What information could change my next decision?
The first question sounds basic, but it becomes complicated fast. A trader may hold long-term equities in one account, short-term crypto positions in another, and leveraged forex exposure elsewhere. Viewing each balance in isolation creates a false sense of diversification. A connected dashboard reveals exposure by asset, sector, currency, strategy, or correlated market theme.
The second question is where surface-level portfolio tracking often falls short. Position size alone does not define risk. Leverage, concentration, unrealized drawdown, stop distance, volatility, and correlation all matter. A dashboard built for serious market participation should make those relationships visible before a position becomes a problem.
Performance analysis is equally important, but it needs context. Win rate is not enough. A strategy with a 40% win rate can be viable if average wins materially exceed average losses. A high win rate can be fragile if rare losses erase months of gains. Useful analytics show expectancy, profit factor, average holding period, maximum drawdown, realized versus unrealized performance, and results by asset class or setup.
Build Around Decisions, Not Just Data
The strongest dashboards organize information around the decisions traders make throughout the day. Before entry, a trader needs market context, planned risk, and conviction. During a trade, the priority shifts to exposure, invalidation levels, volatility, and liquidity. After exit, the focus becomes execution quality and process review.
This structure matters because a dashboard can otherwise become another source of noise. Ten indicators that do not affect a decision are less useful than one clear risk alert. The goal is not to watch every market variable. It is to identify the variables that should change behavior.
Start with a portfolio and exposure view
A portfolio view should show total equity, available capital, open P&L, realized P&L, and current positions. But the real intelligence sits beneath those totals. Traders need to see where capital is concentrated and which positions may move together under stress.
For example, holding a semiconductor stock, a tech index fund, and a large-cap technology call option may look like three separate positions. In a risk event, they may behave like one concentrated trade. The dashboard should make that connection visible.
For crypto participants, the same principle applies across tokens, stablecoin exposure, decentralized finance positions, and derivatives. A single headline or liquidity shock can affect assets that appear unrelated when viewed only by ticker.
Measure risk in a way that changes behavior
Risk analytics are most useful when they are actionable. A trader should be able to recognize that a new entry would push portfolio concentration beyond a defined threshold, that a position now represents too much daily risk, or that several open trades share the same directional assumption.
Relevant measures may include position sizing, leverage, exposure by market, daily loss limits, drawdown, volatility-adjusted risk, and risk-to-reward at entry. The right combination depends on trading style. A long-term investor may care most about allocation drift and sector concentration. A short-term futures or forex trader may prioritize intraday drawdown, margin use, and correlated exposure.
No dashboard can choose a risk limit for the user. It can, however, make the consequences of that limit visible and consistent.
Turn trade history into a feedback system
The trade journal is often treated as an administrative chore. That is a missed opportunity. When execution data is paired with structured notes, tags, and market conditions, it becomes a feedback system for improving a trading process.
A useful review can reveal whether a trader performs better in trend continuation setups than reversals, whether losses cluster after oversized positions, or whether holding through major news events has a measurable effect on outcomes. It can also expose behavioral patterns: chasing breakouts, taking profits too early, averaging down without a plan, or trading more aggressively after a loss.
This analysis requires clean data. Trades should be categorized by strategy, asset class, time frame, and thesis where possible. The objective is not to create perfect labels for every transaction. It is to establish enough structure to identify recurring patterns over time.
AI Should Prioritize Context, Not Certainty
AI-powered analysis can make a dashboard faster and more useful, particularly when a trader manages multiple positions and follows fast-moving information. It can surface unusual exposure changes, summarize portfolio movement, detect repeated execution patterns, and help prioritize relevant market developments.
But AI should not be framed as a substitute for judgment. Markets are adaptive systems, and historical patterns can fail when liquidity, macro conditions, or positioning changes. An AI signal without transparent inputs, limitations, and supporting context can create false confidence.
The better model is AI as an analytical layer. It should help traders ask sharper questions: Why did this portfolio move today? Which open positions are most exposed to the same market factor? How does this trade compare with previous trades under similar conditions? What assumptions would invalidate this thesis?
That approach supports transparency rather than black-box decision-making. It also gives users a way to review the evidence behind an insight instead of simply accepting a recommendation.
Why Verified Community Context Belongs in the Dashboard
Market intelligence does not come only from price data. It also comes from how informed participants interpret catalysts, positioning, earnings, macro events, and changing narratives. Yet conventional social feeds have a trust problem. Anonymous predictions, edited screenshots, and unverified claims make it difficult to separate useful insight from performance theater.
A connected analytics environment can improve that experience by linking ideas to transparent participation. Traders should be able to assess the source, review the reasoning, and distinguish a market observation from a claim of performance. Reputation should be earned through consistency, credibility, and accountable engagement, not follower counts alone.
This is where a platform such as Tyrian Trade can create a more complete operating environment. Analytics, market intelligence , verified community activity, educational content, and trading tools are more valuable when they reinforce one another. A chart may show movement; trusted context can help explain why the movement matters.
Community insight still requires independent verification. Consensus is not a thesis, and a popular trade can become crowded quickly. The dashboard should support research and discussion without encouraging users to outsource responsibility for risk.
A Practical Dashboard Workflow
A dashboard earns its place when it becomes part of the trading routine rather than a report opened after the fact. The workflow can be simple: review exposure before the session, monitor only decision-relevant risk during it, and conduct a focused review afterward.
Before markets open, assess open positions, upcoming events, capital allocation, and concentration. Identify what would change your plan. During the session, avoid constant metric checking unless conditions warrant it. Too many alerts create alert fatigue, especially for traders operating across volatile markets.
After the session, review both the financial result and the quality of execution. Did the trade follow the planned thesis? Was risk sized correctly? Did the exit reflect new information or emotion? Over time, these small reviews create a dataset that is more valuable than a single dramatic win or loss.
The dashboard should also be configured to the trader, not the other way around. An investor who rebalances monthly needs a different interface from a day trader managing several intraday positions. Start with the metrics that govern your actual process, then add complexity only when it improves a decision.
A well-designed trader analytics dashboard does not promise certainty in uncertain markets. It gives traders something more durable: a transparent record of risk, behavior, performance, and market context that makes the next decision easier to defend.