education
Why Use Portfolio Heatmaps for Better Decisions
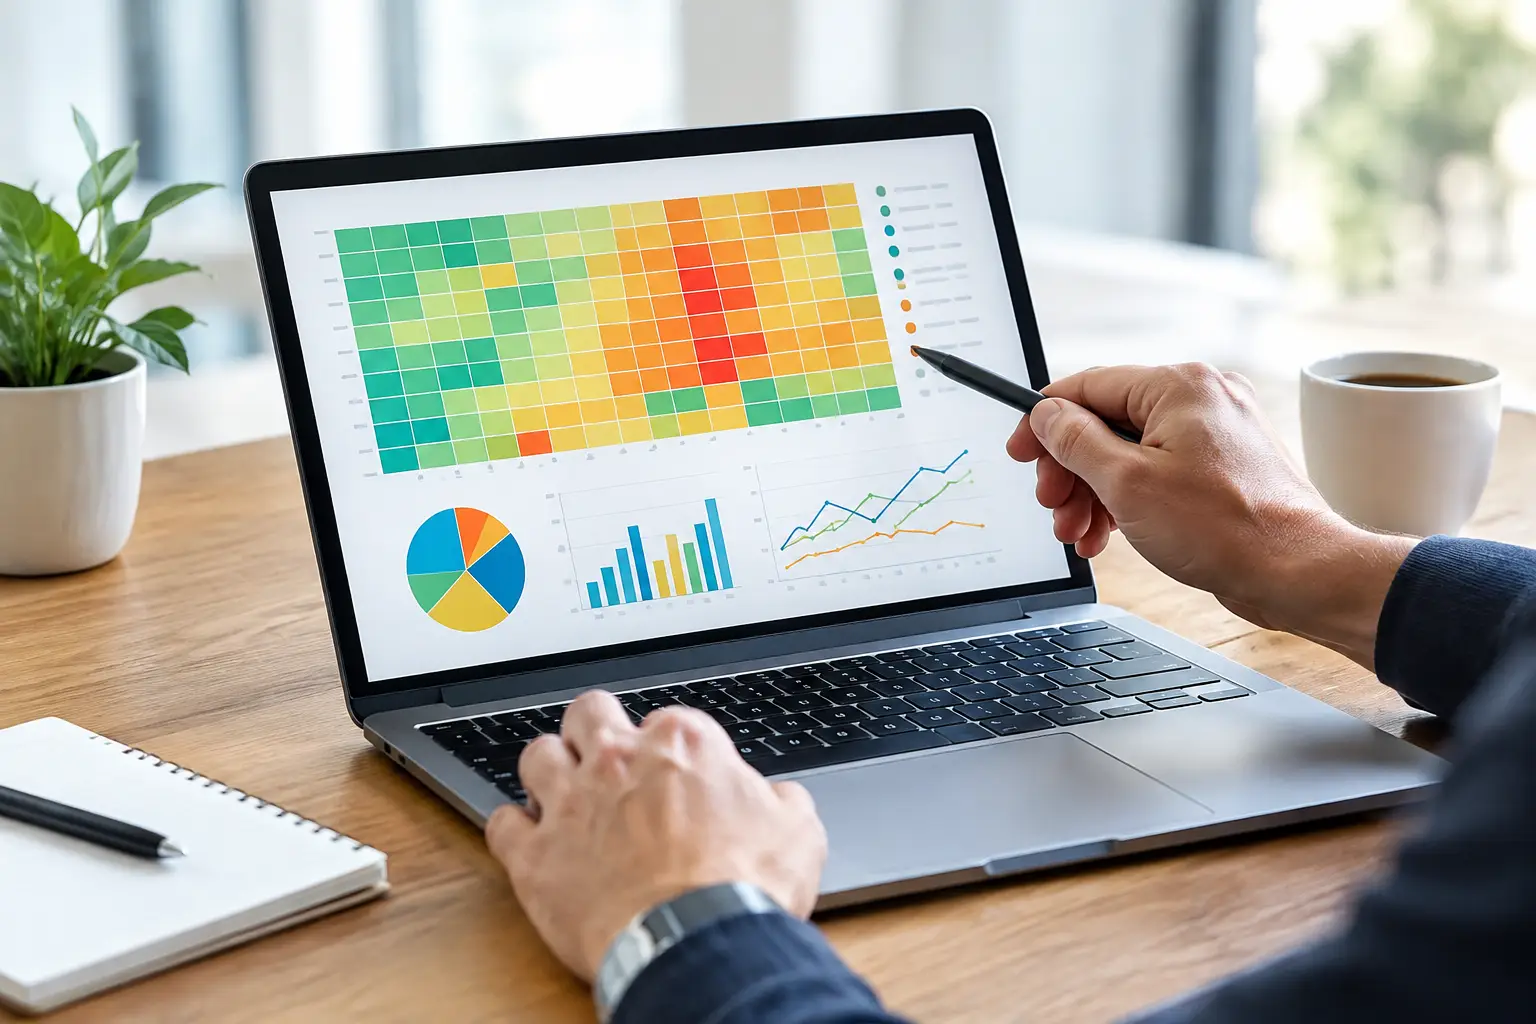
Why use portfolio heatmaps? See concentration, correlation, sector exposure, and changing risk faster so every investment decision has clearer context.
A portfolio can look diversified on paper while carrying the same economic risk in several different places. Five positions may have different tickers, exchanges, or narratives, yet all move when one sector sells off, a currency shifts, or risk appetite disappears. That is why use portfolio heatmaps is a question serious investors should ask before the next volatile session, not after it.
A heatmap turns portfolio data into a visual risk surface. Instead of reading a long list of positions and percentages, you can see what is large, what is moving, what is winning, and where exposure is clustering. For active traders managing stocks, crypto, forex, or a mix of global assets, that speed matters. Market intelligence is only useful when it arrives in a form that supports a decision.
Why Use Portfolio Heatmaps Instead of a Position List?
A traditional position list is necessary, but it is not designed for rapid pattern recognition. It tells you the name of an asset, the quantity held, the average entry price, and perhaps the unrealized profit and loss. To understand the portfolio, however, you still need to connect the dots manually.
A portfolio heatmap does that first layer of synthesis visually. Each block represents an asset, sector, strategy, or account. Size can represent position weight, while color can represent daily performance, total return, volatility, or another selected metric. Large red blocks immediately draw attention to positions that are both meaningful and under pressure. A cluster of similarly colored blocks can reveal that several holdings are reacting to the same market force.
The point is not to replace analysis with color. The point is to direct analysis where it is needed most. During fast markets, attention is a limited resource. A well-designed heatmap helps allocate it with more discipline.
See Concentration Before It Becomes a Problem
Concentration is often more subtle than a single oversized position. An investor may limit each stock to 5% of the portfolio but still have 35% tied to semiconductors, high-growth technology, Bitcoin-linked equities, or rate-sensitive assets. The position count looks diversified. The underlying exposure is not.
Heatmaps make this easier to identify by grouping holdings by sector, asset class, geography, market capitalization, or custom themes. When related assets occupy a large share of the screen, the portfolio's true dependency becomes harder to ignore. That does not automatically mean the portfolio is poorly constructed. A concentrated portfolio can be deliberate when the investor has high conviction, a defined thesis, and a credible risk plan.
What changes is the quality of the decision. You are no longer calling the portfolio diversified simply because it contains many symbols. You can decide whether the concentration is intentional, whether it fits your time horizon, and whether your downside assumptions remain realistic.
For traders, this is especially relevant around event risk. Earnings season, central bank decisions, inflation releases, and crypto liquidity shocks can affect multiple positions at once. A sector or theme heatmap can show whether one event has the potential to influence most of the account.
Correlation Is Not Always Visible in the Ticker Names
Correlation risk is one of the strongest arguments for visual portfolio analysis. Assets do not need to share an industry label to move together. A technology stock, a high-beta crypto asset, and a growth-focused exchange-traded fund may all respond sharply to the same change in interest-rate expectations. A forex position can influence the risk profile of international equity holdings even when it is managed in a separate account.
Heatmaps cannot calculate every relationship by themselves, but they make behavioral patterns easier to spot when combined with correlation, beta, and factor analytics. If several unrelated-looking blocks repeatedly turn red at the same time, that is a prompt to investigate the shared driver. Is the portfolio exposed to the same liquidity conditions? The same currency? The same momentum factor?
This is where connected analytics become more valuable than disconnected dashboards. A portfolio view should not treat each position as an isolated trade when the market clearly does not.
Use Heatmaps to Make Risk Actionable
The strongest portfolio tools do more than report yesterday's results. They help define what deserves attention now. Heatmaps support that goal because they translate raw portfolio data into a hierarchy of relevance.
A trader can use a daily performance heatmap before the open to identify positions with unusual moves. An investor can review allocation heatmaps monthly to check whether strong performance has caused one theme to become too large. A multi-account user can view combined exposures to avoid overlooking a risk that is distributed across a brokerage account, a crypto wallet, and a trading strategy.
The practical value comes from pairing the visualization with a decision framework. When a heatmap flags a large position or a broad cluster of losses, the next question should not be, "Should I sell because it is red?" It should be more specific: Has the thesis changed? Has position size exceeded the original plan? Is the movement temporary volatility or evidence that the market regime has shifted?
That distinction protects against reactive trading. Heatmaps are an early-warning and prioritization layer, not a buy-and-sell signal generator.
Measure Performance in Context, Not in Isolation
Green and red are useful, but they can also be misleading without context. A 4% gain in a speculative asset may be ordinary volatility. A 1% decline in a heavily weighted defensive position may have a greater impact on total portfolio performance. Block size changes the story.
This is why a portfolio heatmap should allow different views. Daily change is useful for monitoring current conditions. Total return highlights what has contributed over time. Allocation view shows where capital is committed. Volatility and drawdown views reveal where apparent returns may be carrying disproportionate risk.
For example, a portfolio may show strong total gains in a small cluster of high-volatility assets while the largest allocation remains flat or declining. Without a visual weighting system, an investor might overestimate how much those winners are actually helping the account. Conversely, a modest loss in the largest allocation can explain why a portfolio feels weaker than a list of mostly green positions suggests.
Clear context also improves communication. When discussing a portfolio with a trading community, analyst, or collaborator, a visual representation makes it easier to explain the size and relevance of a position without broadcasting vague claims about performance. Transparency improves the quality of market discussion.
Portfolio Heatmaps Support Better Rebalancing Decisions
Rebalancing is often framed as a calendar task. In practice, it should respond to allocation drift, risk concentration, and changes in conviction. A heatmap makes drift visible.
If a winning sector has expanded from a controlled allocation into the portfolio's dominant exposure, the investor can assess whether to reduce it, protect gains, or allow the trend to continue. There is no universal answer. Tax considerations, trading costs, liquidity, investment horizon, and the strength of the original thesis all matter.
The advantage is that the choice becomes explicit. Without a visual view, allocation drift can remain hidden behind a series of individually reasonable decisions. Adding to a winner, holding through a rally, and opening adjacent positions can gradually create a portfolio that behaves very differently from the one originally intended.
For short-term traders, the same principle applies at a faster cadence. A heatmap can reveal whether several open trades are effectively one large directional bet. That insight may lead to smaller size, tighter aggregate risk limits, or a decision to avoid adding exposure until the market picture is clearer.
What a Useful Portfolio Heatmap Should Include
Not every colorful dashboard delivers meaningful intelligence. A useful heatmap begins with accurate, current data and gives the user control over what color and size represent. It should make it easy to move from the broad portfolio picture into the underlying position, supporting verification rather than obscuring detail.
Look for views that can organize exposure across the dimensions that actually shape your decisions: asset class, sector, geography, strategy, account, and time period. For active market participants, live or near-real-time updates matter. For longer-term investors, clear historical comparisons and allocation trends may matter more.
The best experience also connects heatmaps to deeper analytics. Seeing a concentrated group is valuable; understanding the correlation, drawdown, earnings exposure, or macro factor behind that group is more valuable. On a connected financial intelligence platform such as Tyrian Trade, portfolio visualization can become part of a broader workflow that includes market research, verified discussion, and AI-assisted analysis .
A Better View Creates Better Questions
Portfolio heatmaps do not eliminate uncertainty, and they cannot tell you what markets will do next. Their real value is more disciplined than that. They expose the questions a position list can hide: Where is the portfolio truly concentrated? What is driving today's risk? Which gains matter most? What has changed since the original allocation was built?
When markets move quickly, clarity is a competitive advantage. A heatmap gives investors and traders a faster way to see the structure behind performance, then make decisions with more context, greater transparency, and a clearer understanding of what they actually own.