S&P 500 ($SPX) Breaches 200-Day Moving Average Intraday, Threatening First Close Below Key Trendline Since...
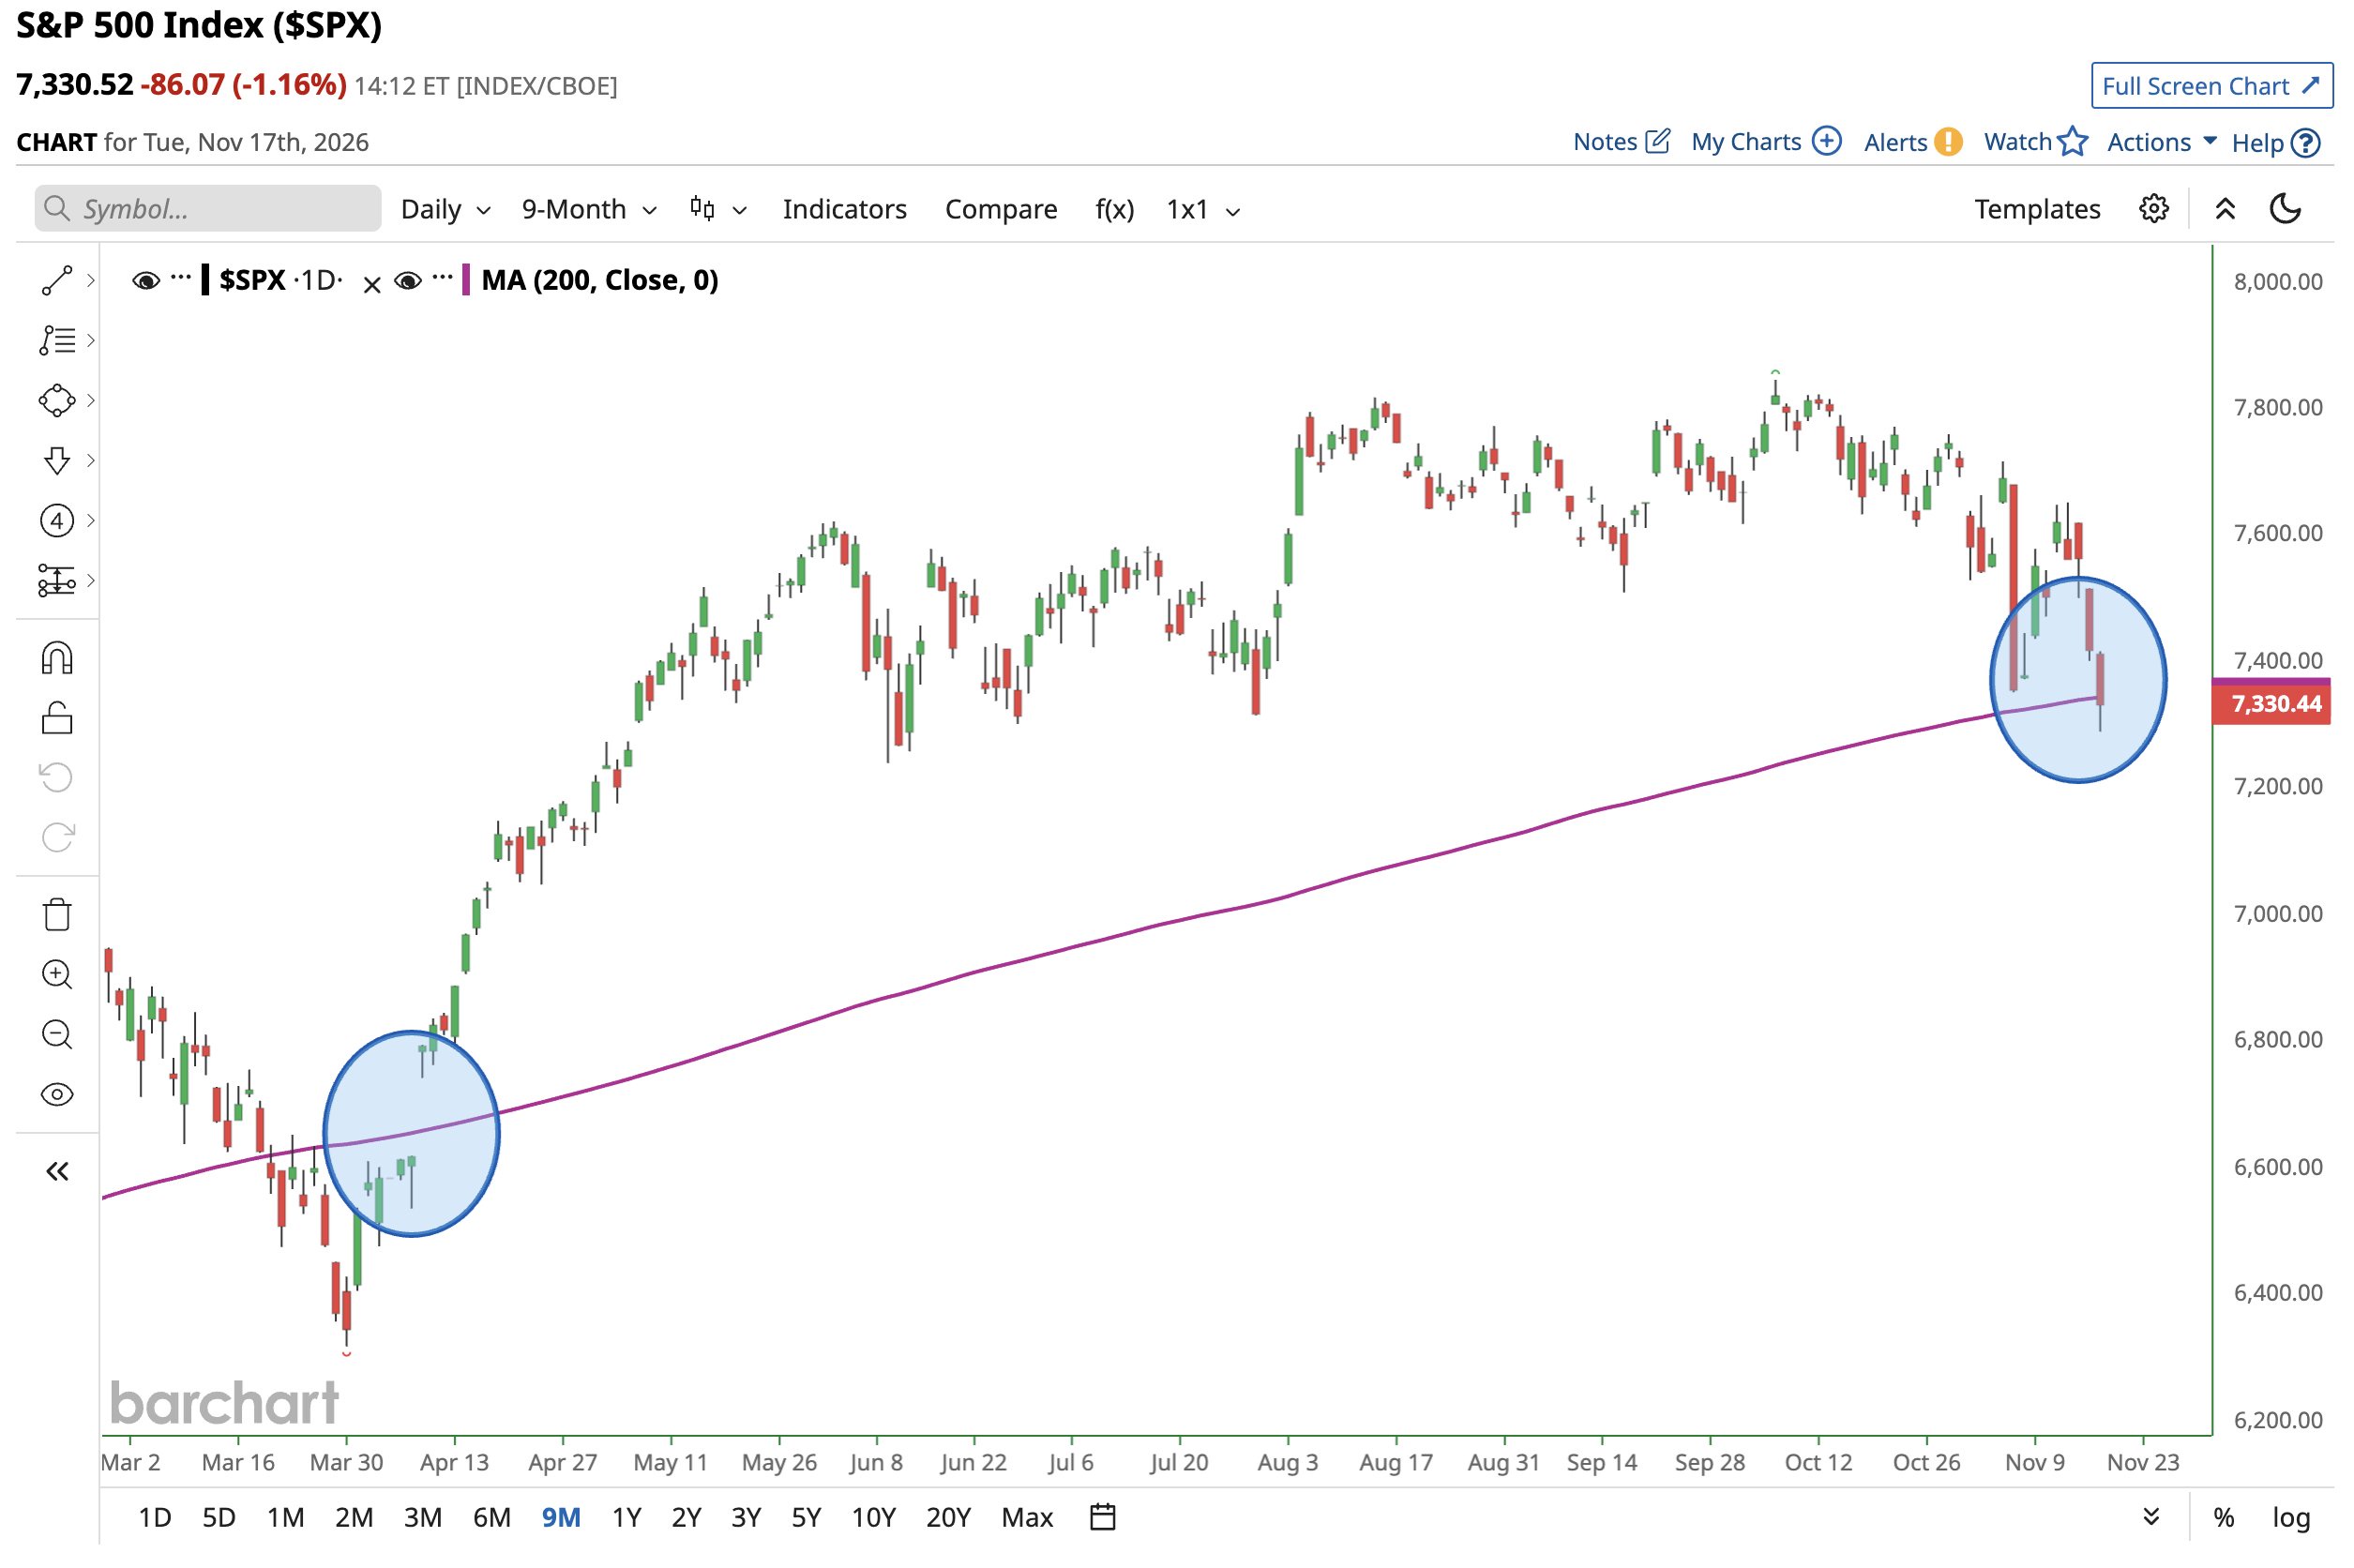
The S&P 500 ($SPX) slid roughly 1.1% to 1.5% during Tuesday's session on November 17, 2026—trading near the 7,307 to 7,335 zone after touching an intraday low of 7,288.34—putting the benchmark index on track for its first close below its 200-day simple moving average (around 7,335 to 7,355) in roughly seven months.
Extending a fourth consecutive daily decline from Monday's 7,416.59 close, the breakdown ends a 129-plus-session streak above the closely watched long-term trendline that began on April 8, 2026:
- Technical breakdown and downside levels: After slipping below short-term support around 7,500 on Monday, sellers pushed the index beneath its 200-day moving average—roughly 1% below Monday's close—and tested July swing lows near 7,292 to 7,298. Technical analysts note that a confirmed daily close below the 7,290–7,355 band shifts market structure lower and exposes the psychologically key 7,000 level, whereas reclaiming 7,500 is required to stabilize near-term momentum.
- Semiconductor drag and pre-earnings de-risking: The drop follows steeper technical deterioration in technology benchmarks—with the Invesco QQQ Trust ($QQQ) already trading more than 3% below its own 200-day moving average and the VanEck Semiconductor ETF ($SMH) well below trend support—as investors cut AI exposure ahead of Nvidia's ($NVDA) post-close Q3 earnings report and Anthropic's ($ANT) upcoming Nasdaq IPO.
- Historical context on 200-day moving average breaks: While closing below the 200-day moving average typically signals heightened near-term volatility, historical market data since 1950 shows that 69% of initial S&P 500 breaks below the line reverse back above it within ten trading sessions, with median 12-month forward returns remaining positive once forced selling subsides.