Options Market Prices In $335 Billion Swing for Nvidia ($NVDA) Earnings, Highlighting Index Concentration...
Derivatives data from Susquehanna indicates options traders priced in an approximate 8.5% post-earnings stock move in either direction for Nvidia ($NVDA)—equating to a potential $335 billion swing in market value that exceeds the individual market capitalization of roughly 90% of S&P 500 ($SPY) companies.
The heightened implied volatility—more than double Nvidia’s average post-earnings move over the prior eight quarters—reflects a rare convergence of leadership uncertainty and elevated expectations following a steep valuation pullback:
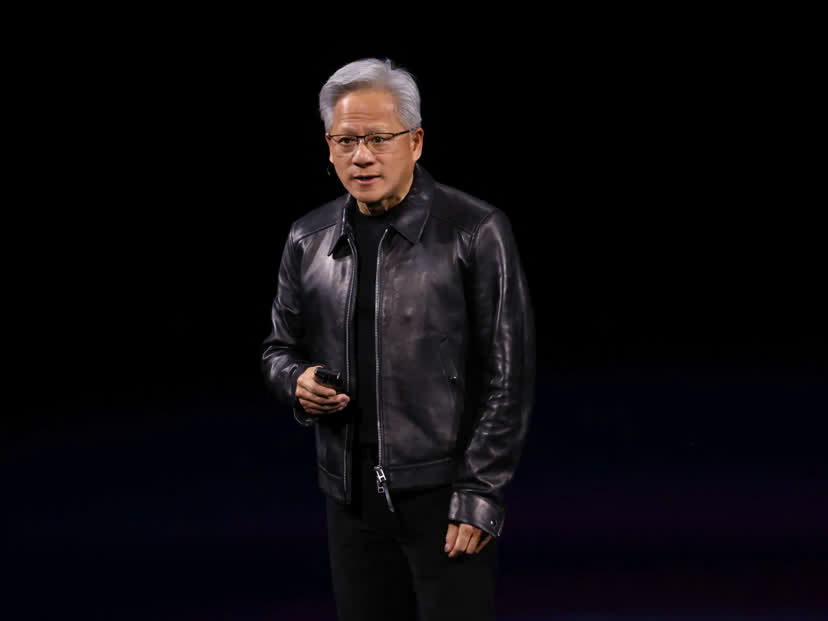
- Leadership Transition and Stock Divergence: Nvidia’s market capitalization retreated from roughly $5.8 trillion in early October to $3.9 trillion by November 13, leaving shares down around 17% year-to-date in 2026 even as the broader S&P 500 gained nearly 8%. The November 17 report marks the chipmaker’s first financial release since longtime CEO Jensen Huang resigned on November 12 and CFO Colette Kress stepped in as interim CEO.
- Benchmark Expectations and Margin Scrutiny: Entering the print, Nvidia guided Q3 revenue to $108 billion (+/- 2%, implying ~12% sequential growth following Q2’s $96.2 billion total and $89 billion in data center sales) alongside a 74% gross margin, down slightly from 75% in Q2. Beyond headline beats, investors are focused on 2027 hyperscaler demand visibility and margin durability.
- Passive Index Concentration Risk: Because Nvidia commands a heavyweight allocation in capitalization-weighted benchmarks like the S&P 500, an 8.5% single-stock swing translates to meaningful ripple effects across passive retirement accounts and 401(k) index funds—underscoring how mega-cap concentration amplifies single-company event risk for diversified savers.